This year was a year where effective defense made the difference. To come out of it with positive returns, as nice as that would be, simply wasn’t in the cards without a healthy dose of risk and even more luck. To lose much less than others, or more importantly, what popular asset classes lost, was a huge victory. The question now of course is where does this leave us as we head into 2023?
To answer this question, it might be most helpful to think about it within the context of time. In weather, it’s pretty well established that forecasting is easier within the next few days than it is two weeks out. The further into the future we go, the more unknown variables come into play. With investing, it tends to be the opposite. What happens to markets over the next few days is anyone’s guess, but as we move months and years into the future, there are times where certainty can actually improve. The reason for this is markets tend to work more like the seasons than short-term weather patterns, which is to say they are cyclical. Of course, the consistency of their cycles is nowhere close to that of the seasons, but there is no doubt a certain cadence to them. Once we understand the factors that impact market cycles, we can improve our sense as to what may happen over broader sections of time.
Recession in 2023
There are no certainties in investing; only probabilities. As we’ve seen repeatedly over the last handful of years, there’s both a first time for everything, and seemingly limitless ability for a few men and women to conduct experiments that attempt, relatively successfully so far, to delay the inevitable. That said, the odds are that we will find ourselves in a recession in the early part of next year (2023). We say this because the current trend in economic growth is lower, the conditions that have caused that trend are still present, and mathematical comparisons going forward will make it hard for growth to reaccelerate. In addition, we are just now starting to see genuine weakness in employment, which of course is always one of the last pieces of the recession puzzle to fit into place. You wouldn’t know this by listening to the “official” establishment employment report. It’s not until you look at the lesser discussed household survey of employment, along with other data points such as new openings and the average manufacturing work week (hours), that you get a clearer sense as to what’s going on. (A reminder to stray from the suggested path if something isn’t making intuitive sense). Job cuts are happening and it’s likely just getting started. Remember, this is the component some have been saying is required for an official recession to take place. Regardless of whether the definition is met and the label affixed, slowing or shrinking economic growth into the first quarter or two of next year sets the stage for our 3-6 month forecast.
Stocks Further to Fall
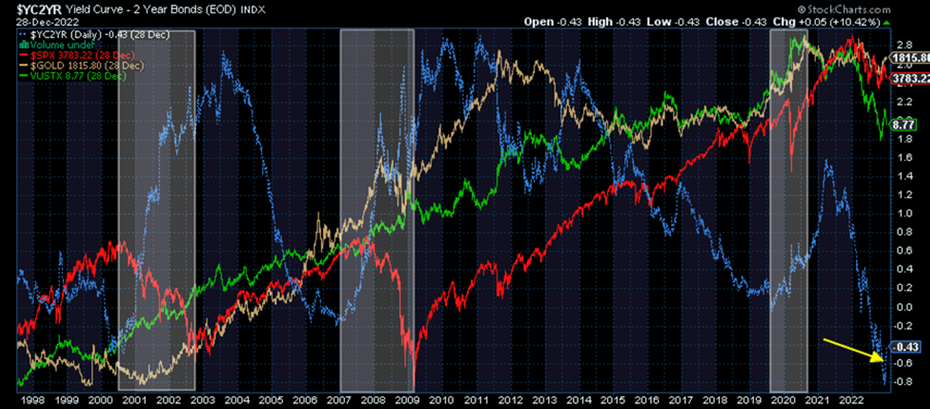
Not only do slowing growth and recession create a generally hostile environment for stocks, but the addition of a deeply inverted yield curve makes the potential for hostility even worse. The chart below looks at the spread between the 10-year treasury yield and the 2-year treasury yield (blue) along with the price performance of stocks (red), gold (yellow), and long-term treasury bonds (green). Over the past 25 years, this 10/2 yield curve has inverted, or gone negative, 4 times with the most recent inversion being one of the deepest on record. As for recession indicators, an inverted yield curve tends to be one of the best as it signifies a very unhealthy financial system where long-term interest rates are lower than short-term interest rates. Not only does that indicate that lenders are requiring more interest to make loans (presumably due to a lack of creditworthy borrowers and high demand for loans in general), but it also suggests that economic activity and demand for funds down the road may not be as robust as right now; hence the lower rates on longer-term debt/loans. In addition, banks and financial institutions that make money borrowing short and lending long cannot make money with an inverted yield curve.
So, to sum all that up, we are sitting near the trough of a deeply inverted yield curve which supports the case for recession. It also suggests that stocks may have a good amount further to fall even after the Fed begins cutting rates and the yield curve begins steepening again. This is a critical point – markets still need to fall (along with inflation coming down a bit) enough to initiate interest rate cuts from Powell and the Fed, and then after that happens, it typically takes more time and additional turmoil before markets bottom. If the last two recessions are any guide, 2020 excluded for its peculiarity, we wouldn’t be at all surprised to see another 30-40% downside in the major stock indices next year. Hypothetically speaking, this could take the form of say another 10-20% decline that gets the Fed to cut rates, after which we get another 20-30% or so further decline. This is a conceptual blueprint, not a forecast. There could be a scenario like in 2020 where crisis is averted, or at least delayed for a bit, or we could have a situation where panicky markets move beyond their mean or “average” valuation levels, in which case it could be worse than a 30-40% decline before we hit bottom. Both are possible, but we’re planning for what we feel is more probable. It’s also important to keep in mind that should we be headed toward a new, much lower bottom for the stock market, 2023 wouldn’t have to encapsulate all of it. It could well play out over years. We’ll take it one day at a time and react to what comes at us.
The flip side of that ugly stock scenario is the gold and green lines on the chart below. Treasury bonds and gold tend to perform much better in recessions and in the early phases of yield curve steepening. This, along with corresponding asset classes, is the defense that served us so well in 2022. There’s no reason to expect it won’t continue to serve us well heading into 2023, and with any luck, on an absolute basis rather than a relative one. Again, no certainties, only probabilities.
Energy
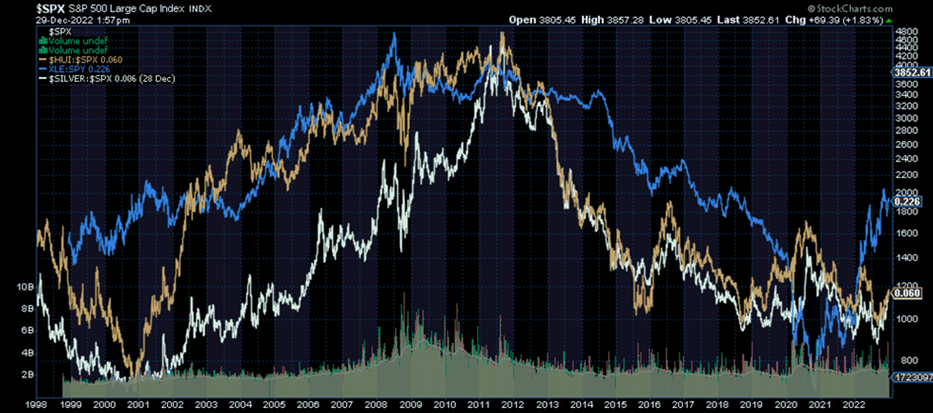
Energy-related investments were one of the few shining stars this year and one that contributed positively for our clients. As with anything that goes up a lot however, there is always a subsequent down often correlating some degree in magnitude. Although our longer-term outlook for energy is still positive, given the tremendous move higher in a relatively short period of time along with the fact that we’re likely getting into the meat of the economic slowdown, the resulting hit to demand for energy beyond what supply issues could compensate for has us expecting more problems than prizes from the energy patch into the first half of next year. The chart below shows the price of energy stocks relative to the S&P 500 (blue). You can see clearly the level of outperformance over the last two years compared to silver (white) and precious metals miners (gold) which still remain historically cheap relative to stocks.
Time As Our Enemy
Although we’d like to believe that the passage of time brings healing, wisdom, and more predictable portfolio returns, almost anyone further along in age will tell you that at some point time turns from being friend to foe. This reality causes some introspection not only around how one spends their time, but around some of the assumptions we’ve made along the way. Time typically heals our wounds, unless we’re doing something nutritionally, chemically, or physically to disrupt or prevent that healing. It brings wisdom assuming that we’re willing to make mistakes, learn from them, and stay open-minded to new information. And the assumption around time being your friend when it comes to buying and holding stocks and bonds we take particular issue with because – A, it’s not always true, and B, it sets up unsuspecting investors for financial ruin. Time, it turns out, can be a fickle foe.
We’ve been discussing for quite some time the fact that Wall Street and its financial heuristics are based on the last 40 years of financial market history which, not-so-coincidentally, also happen to be the best 40 years of financial market history. When one hears something like “buy and hold never fails” or “you’re young, it’ll bounce back”, it’s important to remember that those rules are only mostly factually correct when applied over the last 40 years. There absolutely are periods of time where stock investors would have been underwater for uncomfortably long periods of time, whether it’s the 25 years from 1929 to 1954 or more than a -60% loss to inflation from 1968 to 1982. There is also Japan from 1990 to present, whose Nikkei stock index is still underwater more than 30 years later. The MSCI World Stock Index ex-US is also currently lower than where it was in 2007. The point is, long periods of time where stocks (and other markets) treat us more as foe than friend are far more common than Wall Street would have modern investors believe. We’ve been conditioned to look only at the last 40 years and ignore the rest. Any student of history and follower of cycles knows this isn’t particularly smart. It’s probably also clear to some exactly whose interests it serves most.
All this is to say that 2022 may have been the year that in retrospect will mark the beginning of a long period of mean reversion for U.S. financial markets. With stock valuations still stretched further than any other point in more than 100 years, debt levels at records, zombie corporations infesting the public markets due to bailouts and low interest rates being the norm for too long, and finally, inflation that’s indisputably too high for most to handle, the jig may actually, finally, be up. This economic contraction could be the one that gets the pendulum swinging back toward balance and reasonability. For a “mass market” buy and hold investor, this is a scary prospect. For a human being who likes the idea of less wealth inequality and power concentrated amongst the biggest people and corporations, it’s a more acceptable outcome, as this is part of how positive change happens. Inefficient zombie corporations failing and large powerful companies being forced to price goods competitively without endless performance-indiscriminate liquidity from capital markets will breathe fresh air into the whole economic system. Cycles. Creative destruction. Rebirth. All of which have been stifled over the last 10 to 20 years and has played a part in bringing the world to the seemingly extreme state it’s currently in.
Time is only an investor’s enemy if he’s invested incorrectly, in the wrong things. As you can see from the chart on the previous page, there are still asset classes that are much cheaper than the traditional ones Wall Street has funneled the masses into over the years. The fact that most investors today all own varying degrees of the same stuff is largely why most asset classes are so expensive today. It’s also why at some point, those same asset classes will become much, much cheaper – there’s no shortage of future sellers, and in a panic, they all start clumsily running in the same direction. This is why time should be much friendlier to she who is invested in reasonable things. Sadly, as was the case this year, the system perpetuates the thinking that the only option for the bulk of an investor’s assets is traditional stocks and bonds. There’s a reason why the average 401k retirement date fund, whether mostly stock or mostly bond, is down almost the same amount this year (~-15 to -20%). One must know who to listen to and use their head in determining if the information they’re getting sounds reasonable and sensible. My rule for filtering through financial market information and otherwise is to run the source through the following questions; 1) Are there embedded conflicts of interest? 2) Are there profit incentives or financial motivations? And 3) Is there regulatory capture? In other words, are the big financial institutions (or otherwise) better friends with their regulators than the regulators are with you? This goes a long way toward getting one pointed in a trustworthy direction. Our goal at Cadence is to always serve as fiduciary for our clients and to always operate in the world we find ourselves in rather than the one we want. Understanding the reality of the landscape is critical to coming up with an effective plan of action.
In summary, although there’s likely to be tremendous volatility in financial markets next year and beyond, there is also tremendous opportunity. The stampede of investors that the traditional Wall Street model, as well as ETF and retirement plan model portfolio proliferation has driven into the major asset classes over the years has left other assets largely neglected. As valuations revert to their mean, which they always do, and the stampede finds the land they inhabit increasingly devoid of nourishing grass, those who had the confidence and foresight to break from the herd and plot their own course might instead find themselves grazing in wide open fields of lush, abundant grass. As with anything else in life, breaking from the herd when it is most important to do so is also when it’s the hardest to do so. It takes courage; it’s not easy. On behalf of myself and all of the advisors and staff at Cadence, I want to thank all of our clients for the trust they have placed in us and the courage it has taken to allow us to guide them differently in this respect. It paid off thinking and acting differently in 2022, and like I mentioned above, this may just mark the start of a much longer process. We have a plan. Here’s to confidently embracing 2023 and all it has to offer. Most important, let’s welcome a year rich in good health and happiness.
Editor’s Note: This article was originally published in the January 2023 edition of our “Cadence Clips” newsletter.
Important Disclosures
This blog is provided for informational purposes and is not to be considered investment advice or a solicitation to buy or sell securities. Cadence Wealth Management, LLC, a registered investment advisor, may only provide advice after entering into an advisory agreement and obtaining all relevant information from a client. The investment strategies mentioned here may not be suitable for everyone. Each investor needs to review an investment strategy for his or her own particular situation before making any investment decision.
Past performance is not indicative of future results. It is not possible to invest directly in an index. Index performance does not reflect charges and expenses and is not based on actual advisory client assets. Index performance does include the reinvestment of dividends and other distributions
The views expressed in the referenced materials are subject to change based on market and other conditions. These documents may contain certain statements that may be deemed forward‐looking statements. Please note that any such statements are not guarantees of any future performance and actual results or developments may differ materially from those projected. Any projections, market outlooks, or estimates are based upon certain assumptions and should not be construed as indicative of actual events that will occur. Data contained herein from third party providers is obtained from what are considered reliable sources. However, its accuracy, completeness or reliability cannot be guaranteed.
Examples provided are for illustrative purposes only and not intended to be reflective of results you can expect to achieve.

