Toward the end of last year’s “Year in Review” piece I wrote: “You may be in the camp of investors that sees a year like this year as an opportunity lost as opposed to a sign that we have entered dangerous stock market times.” 2021 was one of those years where the US stock market outperformed most other investment categories by enough that it may have been easy for investors to assume there was less risk in the market than there really was at the end of last year.
Unfortunately, to many investors’ surprise, 2022 came along and proved that, indeed, there is plenty of risk in the financial markets. There were very few other investment categories that were good places to hide this time around, unlike what has been the norm for the past couple decades. To illustrate this, consider three of the most recent stock market downturns and what happened in the bond markets during those times compared to 2022:

Though corporate and other bond categories may have lost more during these time periods, the average core bond holding held up much, much better in the last two decades during stock market downturns before this year. It’s no wonder that 2022 has been a bit of a shock to many investors’ systems.
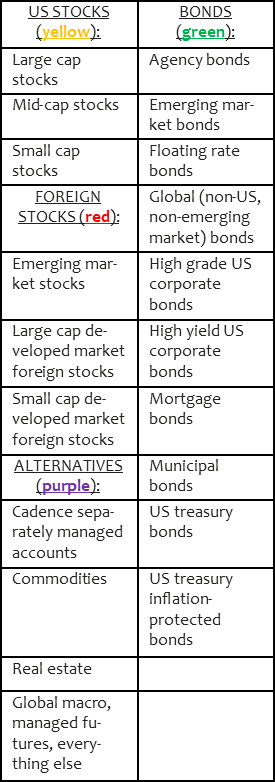
Let’s drill down on the various investment categories’ performances before we acknowledge some probable causes to this year’s pain. The categories we’ll look at are broken out in the table below, and we’ll first look at how all of these categories did, from best to worst.
I will include what a 50% stock, 50% bond portfolio would have done in comparison to all of these categories. It is the blue bar below:
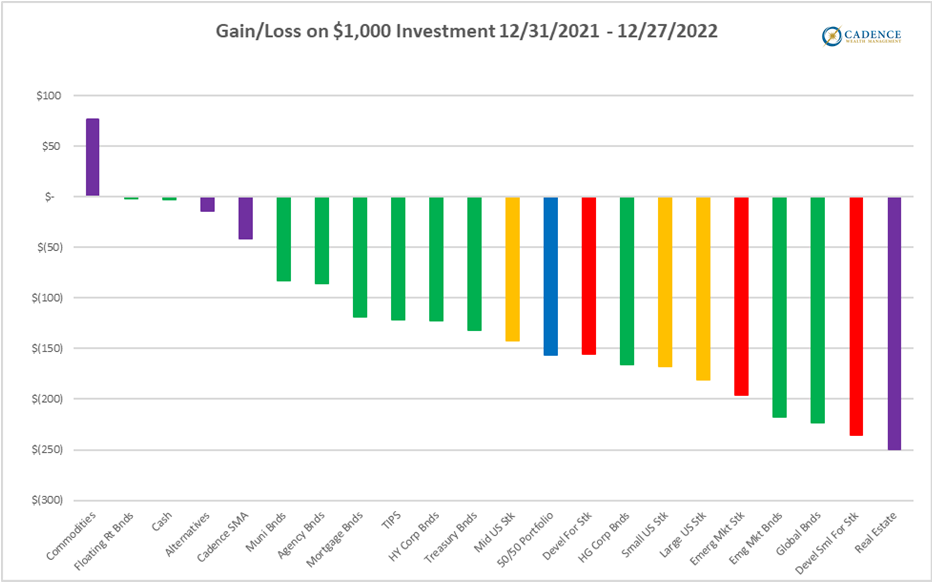
The 50/50 portfolio is just stocks and bonds, so it does not get the benefit of being exposed to the three alternative categories that outperformed it that would have reduced its losses to some degree, however it also has no exposure to real estate which definitely would have hurt it. Not including the alternative categories, the 50/50 portfolio comes in roughly in the middle of all the returns, which is not a huge surprise given its composition. Still, in a year where large US stocks are down around -18%, you would normally expect a 50/50 portfolio to have performed better than -15.5%.
Let’s reorganize this chart and group the sub-categories by their major categories:
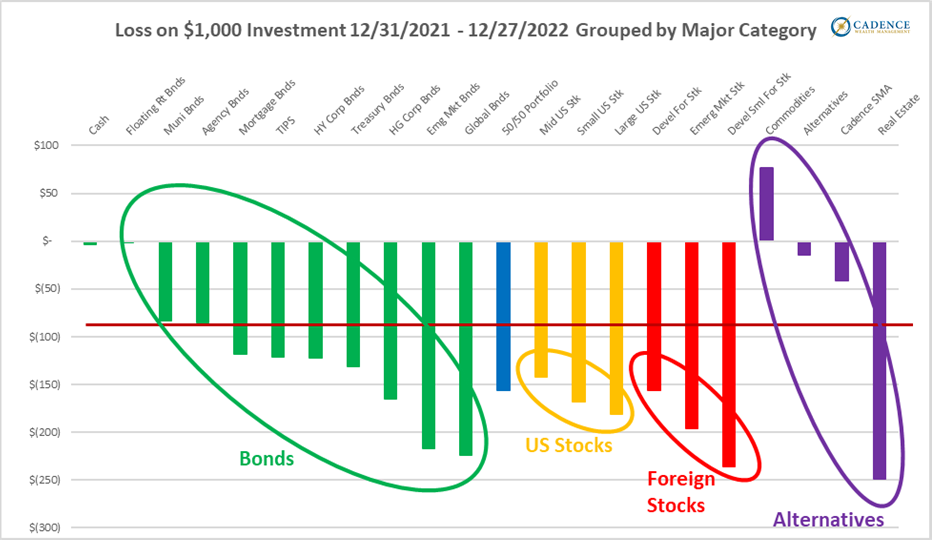
Almost nothing had a good year in 2022. I drew a red line at -10% to show just how many asset classes were down double digits this year. A few of the alternative sub-categories had good relative years, including the Cadence Separately Managed Accounts, with the real star of this year’s bad show being commodities, specifically oil. To have a positive return in 2022 by buying and holding something you would have had to concentrate your investments into very few things, like oil, which is actually an incredibly risky strategy. Otherwise, traditional moderate portfolios performed pretty poorly this year as evidenced by the -15.5% return on the 50/50 portfolio here in blue. We Cadence advisors have been utilizing alternative investments, while steering clear of real estate, in preparation for the year both stocks and bonds did poorly, so our client accounts performed a fair bit better than traditional portfolios did. Our energy, precious metal, managed futures, and other alternative investments took some of the sting out of a pretty bad year.
I would not normally include real estate in this analysis as it is not a part of the core nor separately managed portfolios we manage at Cadence. I did so to help illustrate what an unexpected year 2022 was, even in areas that were supposed to be expected. We had been calling for inflation to remain high even in the early days when the Federal Reserve was saying it would be transitory. The conventional wisdom in inflationary times is to own tangible, physical assets and inflation-linked securities that can hold their value, the usual suspects being precious metals, US treasury inflation-protected bonds, oil, and real estate, to name a few. Of those, precious metals did ok, oil did well, but the rest did very, very poorly compared to what would normally be expected of them. How can an investment that is linked to inflation like US treasury inflation-protected bonds, and how can an asset that is very obviously a physical, tangible asset like real estate not do well during runaway inflation?
It seems like for almost every asset that was supposed to do well during high inflation, there was some important variable that was strong enough in 2022 to ruin the returns. To combat inflation, the Federal Reserve (finally) got serious about raising interest rates. However, because it waited so long to do so and because inflation spiked as high as it did, the Fed raised rates very quickly by historical standards. The speed with which it raised those rates added to a slowing economy to hurt the real estate sector. Likewise, rapidly increasing interest rates hurt the bond market, and did so to such a large degree that it pulled down the one bond asset category, inflation-protected bonds, that was actually supposed to do well in these conditions. Looking beyond interest rate hikes, the multi-decade strength of the US dollar hurt precious metals and investments denominated in foreign currencies, and motivated the Chinese and Japanese governments to sell major US Treasury holdings to prop up their currencies, which further hurt US bond prices. To say it was a perfect storm is probably an exaggeration, but only probably. And this is just scratching the surface on some of the uncommon factors hurting investments in 2022, without even mentioning an economy tipped to enter an official recession soon (though it arguably already has), and the largest military conflict in Europe since World War II which has pulled in countries from around the globe. With US equity valuations already incredibly stretched, it’s a wonder stocks have held up as well as they have to this point.
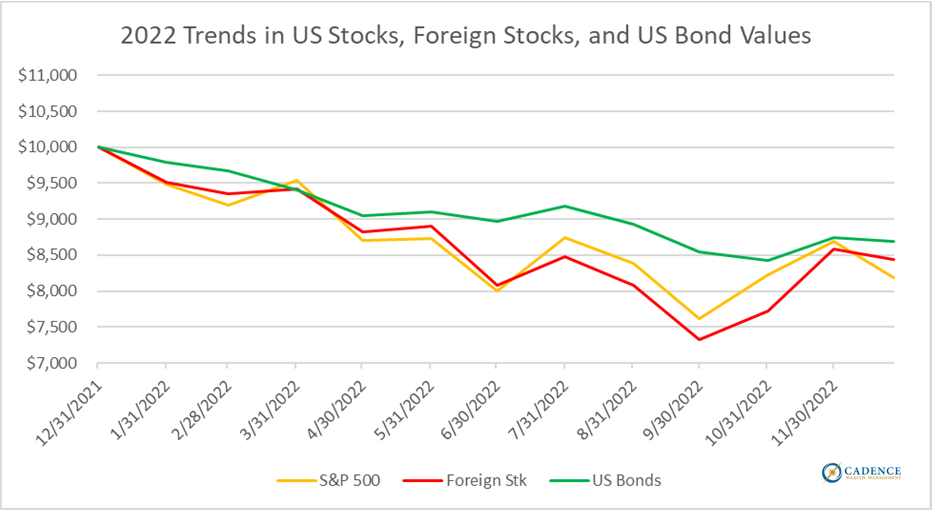
The last chart of this piece shows the performance of US stocks, foreign stocks, and US bonds (mostly government bonds) throughout 2022, each starting from a $10,000 value on January 1st. Despite early spring, mid-summer, and late fall rallies, the trend for all was obviously downward:
2022 was one of those years where a number of chickens came home to roost, and unfortunately found a way to bring their other feathered farmyard friends with them, as most asset categories saw profoundly bad years. Though not unexpected had you been reading our pieces over the last few years, the over-valued stock and bond markets were hurt by a number of variables that were harder to foresee. A war in Europe, multi-decade dollar strength, foreign governments dumping US bonds, and a suddenly aggressive Federal Reserve are just a few of the forces that made 2022 what it was, with every indication many of them will spill into 2023 while our economy continues to weaken. The majority of the pain in the bond market may very well have been felt by now, but the big question for 2023 remains: Will the stock market revisit and surpass the lows it set at the end of the summer?
Editor’s Note: This article was originally published in the January 2023 edition of our “Cadence Clips” newsletter.
Important Disclosures
This blog is provided for informational purposes and is not to be considered investment advice or a solicitation to buy or sell securities. Cadence Wealth Management, LLC, a registered investment advisor, may only provide advice after entering into an advisory agreement and obtaining all relevant information from a client. The investment strategies mentioned here may not be suitable for everyone. Each investor needs to review an investment strategy for his or her own particular situation before making any investment decision.
Past performance is not indicative of future results. It is not possible to invest directly in an index. Index performance does not reflect charges and expenses and is not based on actual advisory client assets. Index performance does include the reinvestment of dividends and other distributions
The views expressed in the referenced materials are subject to change based on market and other conditions. These documents may contain certain statements that may be deemed forward‐looking statements. Please note that any such statements are not guarantees of any future performance and actual results or developments may differ materially from those projected. Any projections, market outlooks, or estimates are based upon certain assumptions and should not be construed as indicative of actual events that will occur. Data contained herein from third party providers is obtained from what are considered reliable sources. However, its accuracy, completeness or reliability cannot be guaranteed.
Examples provided are for illustrative purposes only and not intended to be reflective of results you can expect to achieve.

