One of the data points we follow to help us gain insight into the current condition of the stock market is called the Hindenburg Omen count. Originally created by James Miekka, its primary criteria is for at least 2.2% of stocks trading in the stock market to be both making new highs and new lows on the same days. Those days are tallied and looked at cumulatively to identify periods of divergence within a particular stock market index. The idea is that when you get disagreement within the stock market, it could mark a potential turning point. Below, is our version of Mikka’s indicator where we use a 1.75% threshold for those new highs and lows during a stock market uptrend. What we can see fairly clearly is that we had a large number of Hindenburg Omen days cluster around major historical market turning points. The last few months marks the largest argument that’s ever taken place within the Nasdaq index between stocks making new highs and those making new lows. Very interesting. We can also see that there were a number of false signals where we had those clusters without the markets subsequently turning meaningfully lower.
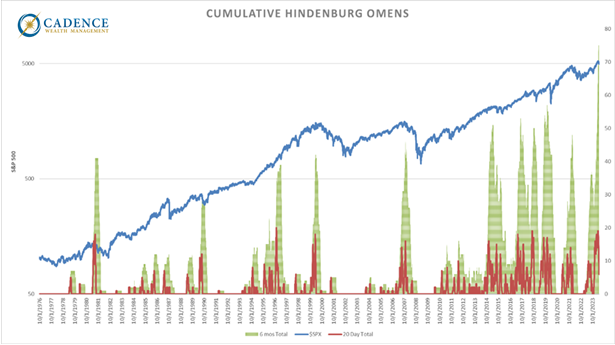
The takeaway here is to look at signals like this as a condition. It’s often required for major market breakages, but not sufficient in itself to cause or predict them. This is why we look at a number of market indicators to form a singularity of message with respect to the inherent risk in markets. I’ll add that a fair number of those indicators are singing the same tune at the moment. Not a good time to chase yesterday’s performance.
Editor’s Note: This article was originally published in the May 2024 edition of our “Cadence Clips” newsletter.
Important Disclosures
This blog is provided for informational purposes and is not to be considered investment advice or a solicitation to buy or sell securities. Cadence Wealth Management, LLC, a registered investment advisor, may only provide advice after entering into an advisory agreement and obtaining all relevant information from a client. The investment strategies mentioned here may not be suitable for everyone. Each investor needs to review an investment strategy for his or her own particular situation before making any investment decision.
Past performance is not indicative of future results. It is not possible to invest directly in an index. Index performance does not reflect charges and expenses and is not based on actual advisory client assets. Index performance does include the reinvestment of dividends and other distributions
The views expressed in the referenced materials are subject to change based on market and other conditions. These documents may contain certain statements that may be deemed forward‐looking statements. Please note that any such statements are not guarantees of any future performance and actual results or developments may differ materially from those projected. Any projections, market outlooks, or estimates are based upon certain assumptions and should not be construed as indicative of actual events that will occur. Data contained herein from third party providers is obtained from what are considered reliable sources. However, its accuracy, completeness or reliability cannot be guaranteed.
Examples provided are for illustrative purposes only and not intended to be reflective of results you can expect to achieve.

