If you think about the last time we had widespread social strife and turmoil in the United States in tandem with expensive financial markets, your recollection will probably take you back to the sixties. Between anti-war protests, the civil rights movement, entitlement reform, and a re-tooling of criminal justice policies and laws, there was plenty of fodder for calm, dispassionate chats with friends and family. It’s probably no coincidence that this swell of activity came toward the end of a post-World War II economic expansion that brought economic comfort to many and stock markets to rather lofty heights. What followed, in the financial realm, was biting inflation for nearly 20 years, and a stock market that popped and went nowhere from 1968 to 1982. Worse than having the same account balance 14 years later, after accounting for inflation, investors would have lost ~65% of their wealth hanging out in the S&P 500. In many ways, today’s circumstances look very similar to those in the late 1960s.
Lessons For Today
Overpriced, overhyped markets eventually spawn corrective periods that can last much longer than we’d think, given the long period of positive conditioning leading up to them. These corrective periods can be tremendously destructive financially, especially when coupled with inflation. There are no do-overs when generational bubbles pop. The responsibility falls on each individual to understand the risks inherent in markets, sectors, and asset classes, evaluate them, and take steps to minimize them. In the end, no differently than how we should feel about our own health, we are responsible and accountable for the decisions we make. Nobody cares more about our own situations than we do and our clients know very well that we’re not leaning on cues from Wall Street or financial media when it comes to financial markets. There are no bells rung at important moments. In fact, it’s quite the contrary. The most important moments often feel the most benign. The combination of positive recency bias, conflicts of interest, and greed make elevated risks extremely hard to see. We see some, however.
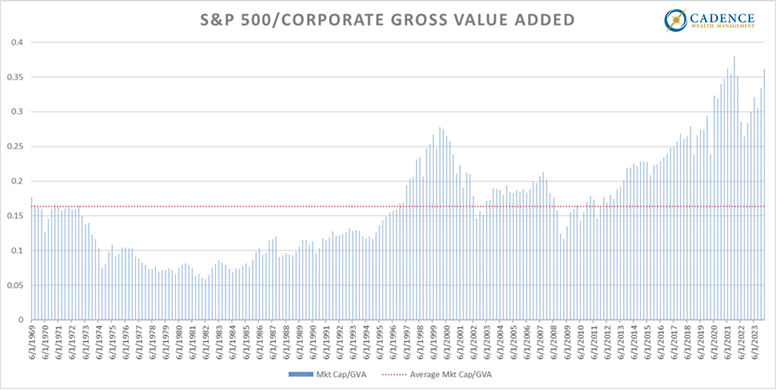
Below is a chart going back to the 1970s of the S&P 500 relative to the level of goods and services produced and sold in the economy. The red line in the chart is the average ratio between the two, and as you can see, the valuation of the stock market has fluctuated around this average. You’ll notice that stocks became “cheap” throughout the 1970s after having been expensive in the 1960s (you can’t see that in this chart due to data provider limitations, but you’ll have to take my word for it). This cheapness led to the best two-decade stretch for stocks throughout the eighties and nineties, which of course morphed into the biggest bubble in U.S. market history at that time – the Tech Bubble. When that popped, Federal Reserve rate cuts gave birth to housing market speculation which precipitated the housing and financial crisis of 2007 and 2008. After stocks dropped more than -50% by March 2009, they were genuinely cheap relative to most economic measures, but not for long. By 2013, we were back up to levels we’d consider expensive based on long-term traditional valuation measures. Where are we now? Off the charts – biggest bubble in U.S. history – and we have been for a while. What this chart should scream to everyone is that risk far outweighs opportunity for returns over time. Could the stock market go up for another week, month, or year? Sure, but eventually it will work its way back through average and to genuinely cheap territory, because that’s what valuation cycles do.
Getting Back to Average
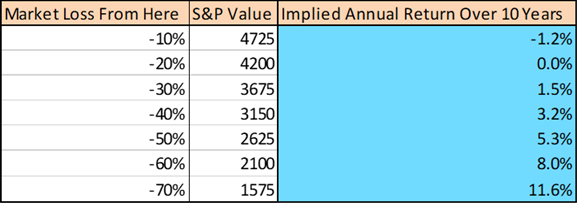
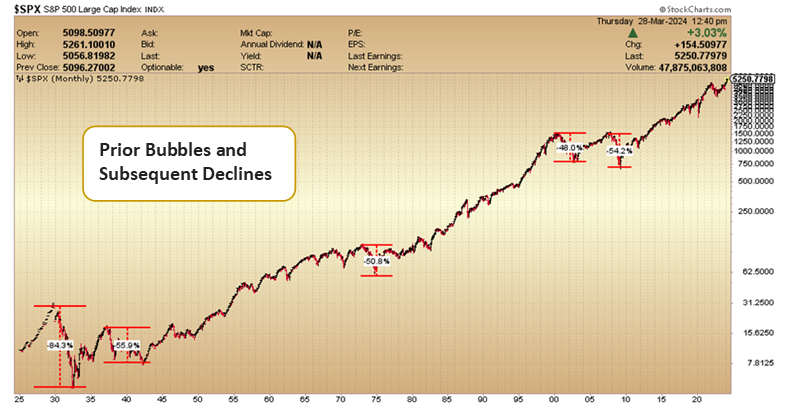
If the level of the S&P 500 was at the red line above (average price relative to economic output) ten years from now, it would be more than -30% lower based on our estimates of economic growth. That’s 30% less account value than investors have today. The question we often get from clients is, “When will the stock market be investable again?” Below, we can see that it really isn’t until the S&P 500 drops -50% that we’re back to reasonably expecting returns north of 5% over a ten-year timeframe. We’re truly back in business if stocks drop -60% or more from here. This may sound inconceivable, but don’t forget that 50% declines are common when stocks get too pricey. We saw this threshold roughly met or outright breached in 1932, 1937, 1974, 2002, and 2009, all declines stemming from bubbles smaller than today’s.
A Grim Stock Market Reality Doesn’t Equal Pessimism
Our clients know that our current view on financial markets doesn’t mean we’re not optimistic. There is always an opportunity somewhere. The nature of cycles and the factors that drive them usually means that there is something else out there at another point in its cycle that holds more promise. Speculative bubbles take place because more and more people jump in over time. Good returns garner attention, which leads to more money flowing in, which leads to more returns, and on and on the pattern goes. Success begets success until one day, somebody says, “What the heck am I doing paying five times my annual income for a tulip bulb?” That realization, or a similar small change in behavior by somebody, somewhere is what starts the process of sending the whole thing into reverse.
What’s happening along the way, as more and more money goes into the shiny, upward-trending speculation, is other classes or groups of assets are being neglected. This neglect leads to subpar returns, which leads to more neglect, etc. An upward speculative cycle in one thing creates an opposite value-creating cycle in another. Real assets, or commodities, are a category of asset that have been left behind throughout this epic run-up in stocks, and they are now at levels that offer very compelling long-term opportunities – similar to those of the early 1970’s and early 2000’s.
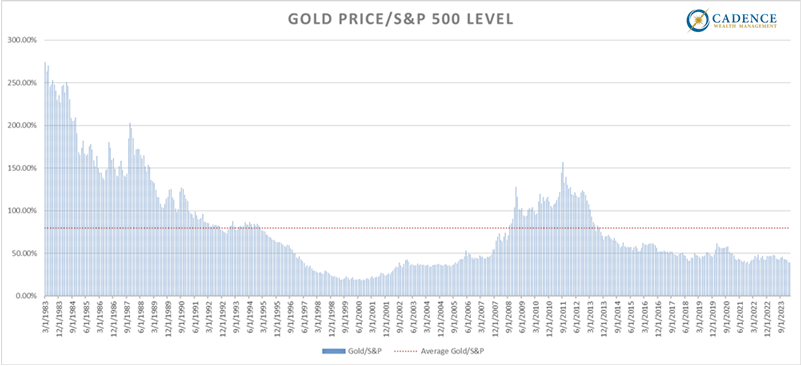
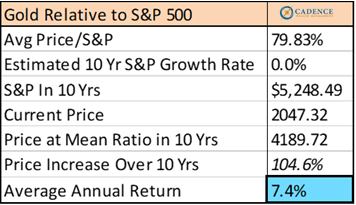
Below is a chart showing the price of gold relative to the S&P 500 going back to the early 1980’s. The relationship currently lies well below the average of the last 40 years. Getting back to an average level over the next ten years, given our assumption that stocks go nowhere due to their current lofty levels, would result in a doubling of the gold price.
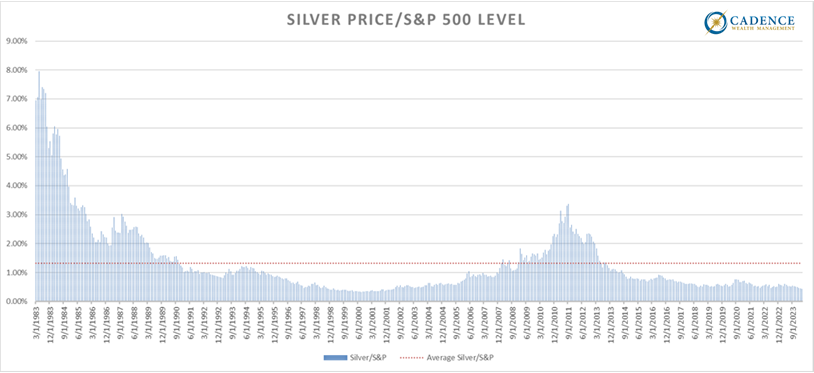
Below, we see the same analysis for the price of silver, which is even cheaper than gold relative to its historical relationship to the stock market. Getting back to average with stocks staying static would result in closer to a 200% gain in the price of silver from current levels. Many other commodities share this theme given that they’ve spent the last 13 years or so going down rather than up. The thing about buying cheap assets that represent good value is that we need to be comfortable buying something that’s gone down a lot. This can be extremely hard to do as our human brains compel us to chase the mob that’s chasing the shiny thing. Of course, there are things we can try to do to make sure we’re not catching a falling knife, but the fact is the portfolio that makes the most sense for the next 5 to 10 years has almost always done far worse than other portfolio mixes looking backward 5 to 10 years. By contrast, the asset classes that have done the best in hindsight will likely do the worst. These are cycles. We don’t want to overstay our welcome in them, nor be too late to join a nascent one.

Investors, rather than speculators, who have stuck to this discipline have been tested in recent months. As speculators continue to chase stocks to new highs, other asset classes tend to get knocked around on the ground by scurrying feet. Our view is that most commodity categories have already entered their bull cycles, but this isn’t entirely obvious as the flows they receive still pale in comparison to the largest tech stocks. The first couple months of the year were challenging for most commodity categories, but March has seen prices bounce back very aggressively. Investors got a bite at the apple and will likely celebrate their March statements. Patience was rewarded. At cycle turning points, this can feel like the exception rather than the rule, but once money flows change in a meaningful way, from one asset class to another, it becomes more of the rule. Our sense, using history, cycles, financial principles, and a fair amount of logic, is that speculators will soon wish they were investors.
Editor’s Note: This article was originally published in the April 2024 edition of our “Cadence Clips” newsletter.
Important Disclosures
This blog is provided for informational purposes and is not to be considered investment advice or a solicitation to buy or sell securities. Cadence Wealth Management, LLC, a registered investment advisor, may only provide advice after entering into an advisory agreement and obtaining all relevant information from a client. The investment strategies mentioned here may not be suitable for everyone. Each investor needs to review an investment strategy for his or her own particular situation before making any investment decision.
Past performance is not indicative of future results. It is not possible to invest directly in an index. Index performance does not reflect charges and expenses and is not based on actual advisory client assets. Index performance does include the reinvestment of dividends and other distributions
The views expressed in the referenced materials are subject to change based on market and other conditions. These documents may contain certain statements that may be deemed forward‐looking statements. Please note that any such statements are not guarantees of any future performance and actual results or developments may differ materially from those projected. Any projections, market outlooks, or estimates are based upon certain assumptions and should not be construed as indicative of actual events that will occur. Data contained herein from third party providers is obtained from what are considered reliable sources. However, its accuracy, completeness or reliability cannot be guaranteed.
Examples provided are for illustrative purposes only and not intended to be reflective of results you can expect to achieve.

