The experience one expects to have in financial markets comes down largely to whether he or she believes market forces are more natural or artificial in nature. By natural, I’m referring to more free-flowing, random, and at times chaotic, whereas artificial represents controlled, planned, and efficient. An investor couldn’t be blamed for thinking the latter given the tremendous efforts monetary authorities and governments generally have made in recent years to steer favorable market outcomes. This effort to control markets, to create a straighter path, has led many to believe that positive investment results are assured and risks of meaningful losses are negligible. Essentially, the attempted construct of financial markets, particularly over the last 25 years or so, is akin to a city where buildings are erected just so and the city streets are made long and straight.
The reality, however, is that financial markets are complex, as are the humans that interact within them. There is interconnectedness that can’t be measured, tremors under the surface that seem to come out of nowhere, human beings whose behaviors sway from rational to not in unpredictable fashion. In short, although planned market outcomes can work for a while, they eventually succumb to nature. In nature, unlike in our highly efficient city, we have bendy roads, frost heaves, and wildlife constantly disregarding crosswalk guidelines. To the traveler used to city life (the investor whose experience only encompasses the last 12 years), this country drive may seem unpredictable and frustrating. To the rural folk however, who aren’t concerned about expediency and have come to accept the bends in the road, they think less about getting there quickly and spend more time observing the flow of the river down the bank beside them, or the snow-capped mountain peaks on the horizon. The thought of a straight road as far as the eye can see is counter to everything beautiful outside their car window. It’s manufactured and false and would come at a tremendous cost.
Our clients know well how we’ve felt about the inherent risk in markets over the last few years due to the construction of a long, straight, smoothly-paved “financial markets road” that took us very quickly to record valuations while simultaneously creating an extremely complacent investor mindset. Along the way, we’ve seen sinkhole after sinkhole open up, requiring increasing amounts of pavement and repair in order to keep the road intact, which was dutifully applied despite the fact that our public works department spent beyond their means doing so and arguably would have been far better off constructing a simpler road that followed the natural contours of the earth ahead of them. Regardless, this is where we are – at a point where the weight of the road (runaway inflation, debt, and extreme complexity) is now causing it to collapse into the earth. The only choice at this point is to try and buy some time for travelers to exit, find another path, and prepare the controlled demolition so the damage to surrounding areas isn’t too great. This might sound like an unnecessarily scary metaphor, but history suggests it’s fair. Extreme situations tend to lead to similar extremes in the contrary, and there’s no question about how extreme the current situation is, not only in markets, but in political and social life as well. The relative geopolitical and social calm and contentedness of the last 20-30 years has been slowly reaching a boil over the last few, and we think markets are finally starting to follow suit.
About a year ago, both stocks and bonds began their downward slide aided by the reality of much higher than usual consumer price inflation. This inflation is what makes this downdraft in markets different from others in recent years and is the main reason why the Federal Reserve can’t keep putting down pavement to keep traffic moving down the smooth, straight road. Inflation renders the process too dangerous. And so, it’s our contention that global monetary authorities have no choice but to allow markets to break. For the first time in a long time, inflation over time is a larger threat to the average person and to the ruling class than falling asset prices, and so as long as inflation remains too high, asset prices will likely be allowed to fall. The controlled demolition if you will. For more insight on why authorities would do this and how it might play out, I’d direct you to Richard Werner’s book, The Princes of the Yen, where he chronicles how and why Japan did just this in the 1990s.
At some point, if things get bad enough in the economy and markets, this is likely to change. It seems reasonable that government officials and monetary authorities would find a point where inflation would be the smarter risk, but that point may be further off than people and markets currently think. If investors are rescued too early by monetary and fiscal policy actions with inflationary pressures still present, the conundrum facing economic planners now would only grow larger and more dangerous. All this said, we feel it’s likely that the bounce we’ve seen in stocks since October of last year is temporary and will eventually result in a continuation of the bear market decline. How far that goes is anybody’s guess, but it’s likely to give way to more bounces along the way that serve to confuse and fluster investors. That’s the typical blueprint for bear markets and we wouldn’t expect this one to be any different. Our general sense is that when market conditions get bad enough and/or when economic activity appears set to pick back up, we’ll be more broadly constructive on stocks and less risk averse. We’ll cross that beautiful bridge when we come to it; as of yet, it still lies around a corner or two.
Our View From The Bendy Road (In pictures and truncated explanation):
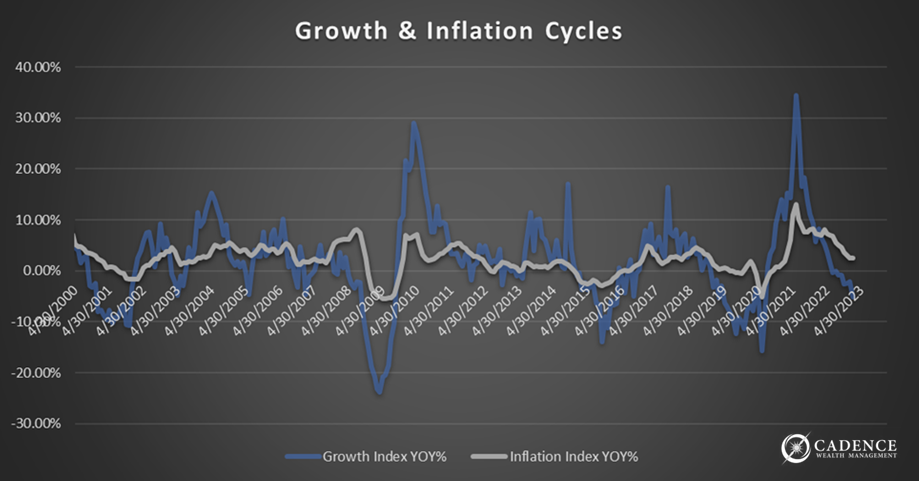
One of the best warning signs of a significant curve in the road ahead is quite literally a chart of curves – sine curves that is. Below is a chart of economic growth and inflation in year-over-year terms, based on our measure of them at Cadence. As you can see, more so with the blue economic growth curve, is that they tend to ebb and flow up and down like a sine curve. One of the best ways to know that an economic slowdown may lie ahead is to see if the growth curve has already expanded significantly. There’s more to it than that of course, but the very nature of cycles is that what spends time going up eventually will spend time going down. Economic growth, although not as predictable as the seasons, is very cyclical and we’ve spent the last year and a half decelerating from the breakneck growth rates following the Covid stimulus wave. Our metric now in negative territory still has a way to go if it’s to resemble the slowdowns of the last 20 years, and like we’ve said, both sides of the sine curve tend to correlate to one another in terms of their magnitude, so this would imply a pretty deep dip into negative territory relative to what we’d consider “normal”.
Inflation, the gray line, is also coming down, but remains a good deal higher than the 2% the Fed has repeatedly stated they want to see it at. Given the sticky nature of some of the inflation we’re dealing with due to supply and geopolitical issues, in addition to the high absolute level of prices based on inflation already experienced, like I’ve mentioned, we see monetary authorities willing to sacrifice economic growth and asset prices in order to decisively slay this inflation dragon. Some evidence of this isn’t only the hawkish and inflation-centric speak by both Jay Powell, the chairman of the Federal Reserve and other Fed members, but also the recent reformulation of how the Consumer Price Inflation (CPI) measure is calculated. The change places a higher weighting on the housing or “shelter” component, which is currently high and tends to lag behind other inputs in direction. That served to bump the most recent CPI report by two tenths of a percent higher than it otherwise would have been. The implication of this is that the higher CPI figure now and over the next few months gives the Fed additional cover to stay tight, battle inflation, and attempt to guide markets lower. This change, because of the lag when housing inflation finally comes down, will also provide ample cover for the Fed to ease monetary policy down the road if they succeed resetting the financial markets table, so to speak.
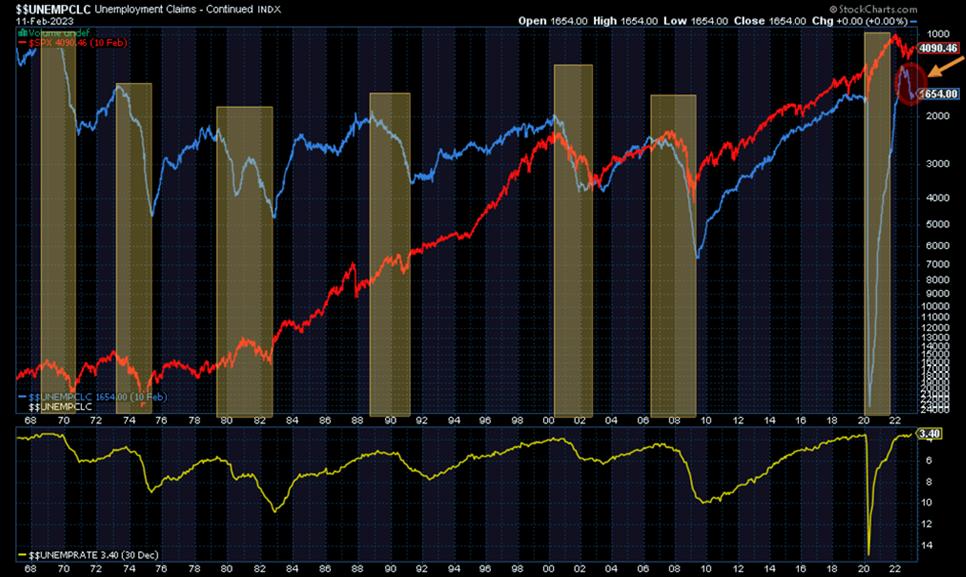
Many economists recently have mentioned that regardless of growth slowing for a number of quarters, you can’t get a recession without a deterioration in employment. Fortunately for those motivated to control the economic narrative, employment statistics are relatively opaque and easy to game. The establishment jobs survey, the nonfarm payrolls report, that comes out every month is a very imprecise way of attempting to measure how many new jobs are added each month countrywide, and is often heavily revised months after being published. The result is what appears to be a great number today may turn out in hindsight to be a horrible number after revisions are made. Additionally, as you can see at the bottom of that chart on the following page, the unemployment rate can look low even though intuitively and empirically it doesn’t seem to fit what we’re seeing around us. Part of the reason for this is that as the participation rate drops (the percentage of the U.S. population actively looking for work), so does the unemployment rate, because unemployment is only calculated using those people who are deemed to be in the pool of employable people. If people weren’t dropping out of that pool, unemployment would be higher, which brings us back to the chart below. The blue line shows continuing claims for unemployment insurance, but has been flipped around to measure up with stock market activity (red). The drop in the blue line represents a rise in the number of people who are collecting unemployment insurance in the U.S., and it’s picked up speed since the third quarter of last year. So, we would suggest that consistent with what we’re seeing around us with layoffs and bankruptcies, the employment picture is weakening considerably and is consistent with what all economists would consider a recessionary environment. Further, as we can see from the chart below, weakening employment tends to correlate highly with a weakening stock market. It’s this deteriorating economic picture coupled with the fact that the stock market remains in a well-defined downtrend that has us seeing more curves ahead with a healthy dose of terrain and wildlife on both sides of the road.
Shorter-Term Market Sentiment:
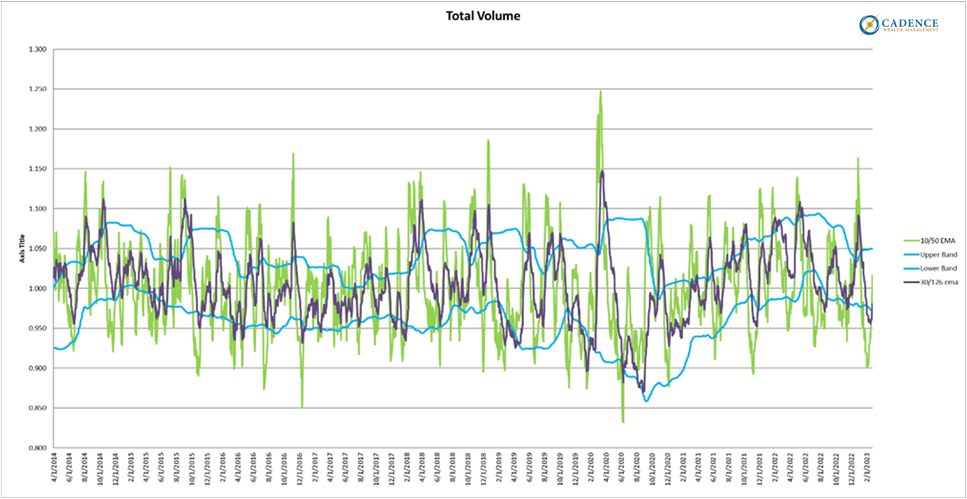
One of the ways we measure potential intermediate-term turning points is by looking at options market activity. The demand for put options (betting on prices going down) relative to call options (betting on prices going up) can tell us a lot about how investors are feeling and acting. In other words, when this behavior reaches extreme levels, it can signal that there are too many people on one side of the boat, which of course is something nautical folks would want to avoid. What we can see in the chart on the next page is that the longer and shorter-term put/call volume ratios for total options markets (purple and green respectively) dropped significantly and are now turning up. This indicates a good deal more call buying (bullish behavior) than put buying and can be a contrarian indicator that the markets may turn lower imminently.
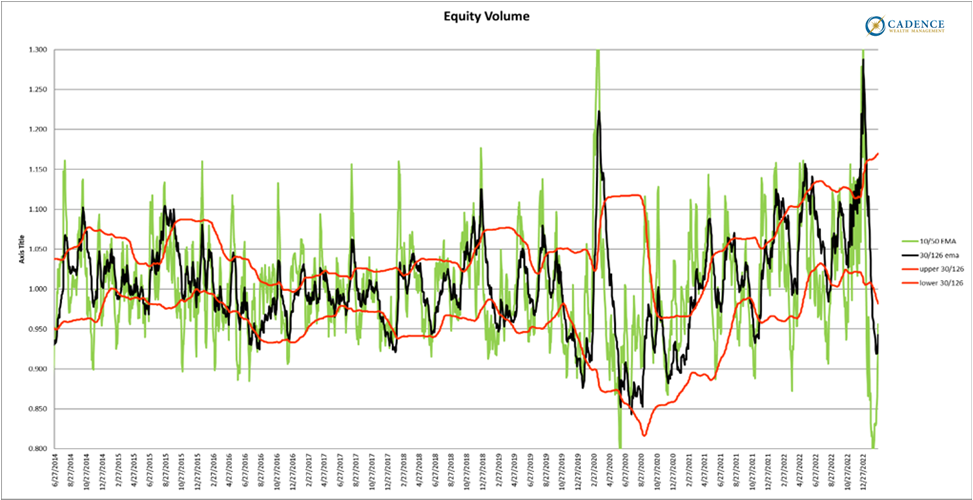
The chart below measures the same thing, except for equity options only (no index options). Although we see the same pattern, what stands out here to us is how low the put/call ratio dropped in the last few weeks. This represents a level of speculation, hedging, or other activity that isn’t standard practice. We won’t speculate on the details here, but suffice it to say that it’s extreme and has contributed to the rally in stocks in recent weeks. Again, all extremes have an inverse direction.
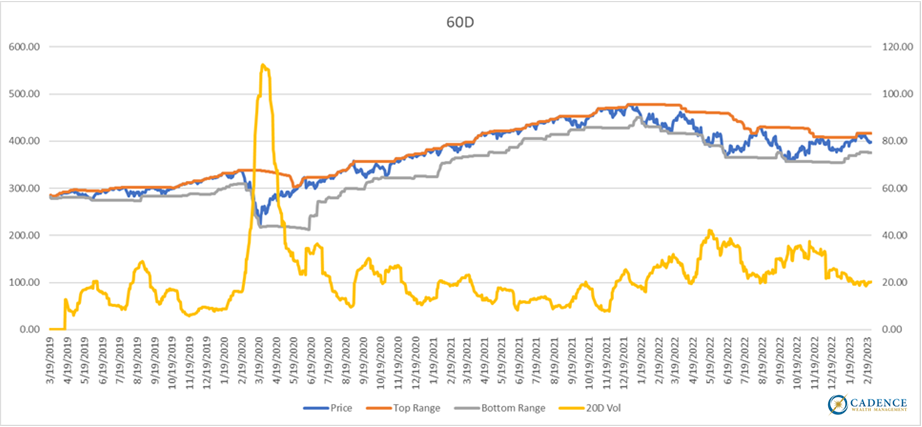
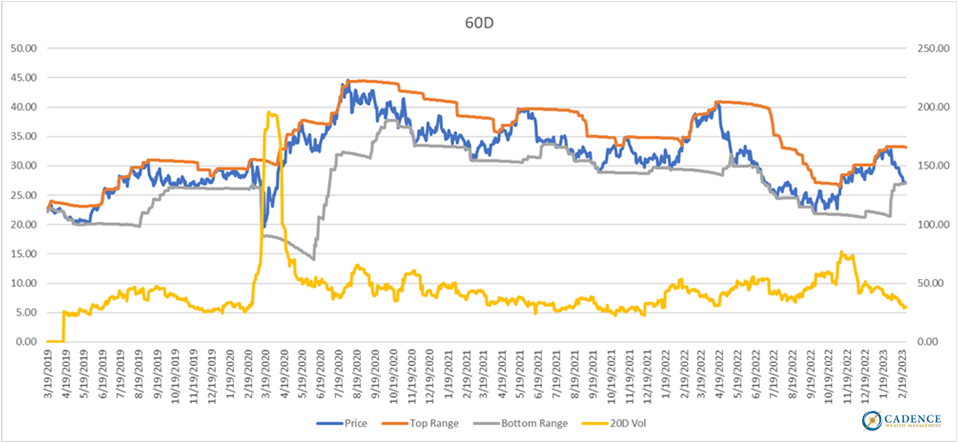
So, given the broad macroeconomic picture as well as the fact that stocks are still in a downturn with a potential resumption lower at hand, we now focus in on some specific asset class price behavior for clues. On the following chart, we’re looking at the S&P 500 price (blue) relative to its volatility-adjusted price range (orange and gray). In a strong downtrend, we tend to see price bounce up to the top of its range from time to time and just the opposite in a strong uptrend. Over the last year, we can see that most of the rallies within the broader downtrend have done just that, with the most recent rally pushing us a little higher. When this pattern is broken, we take note, especially within the context of an improving economic picture. Since we don’t have the former and the markets have recently turned lower, odds are that we’re looking at lower prices ahead. We’ll change if the data changes. It’s also worth mentioning that the yellow line below is realized volatility of the blue line, the S&P 500 in this case. Notice the low points in this yellow line in recent months all being at similar levels and corresponding to short-term market peaks.
SPY:
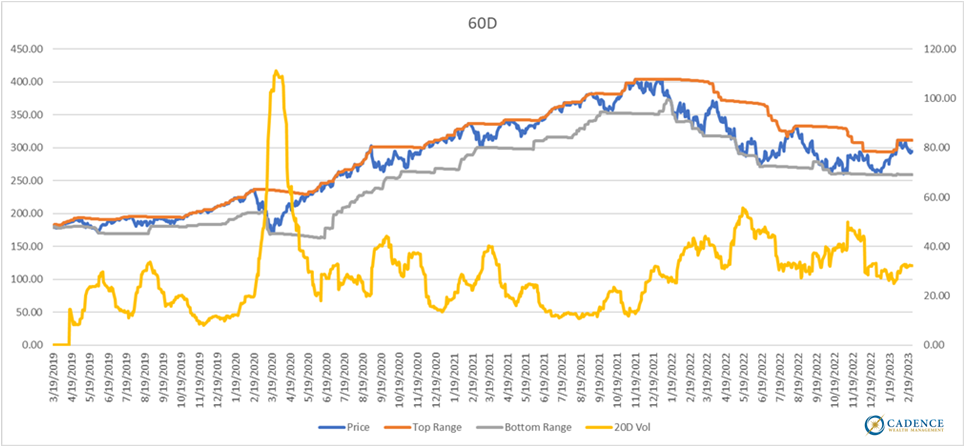
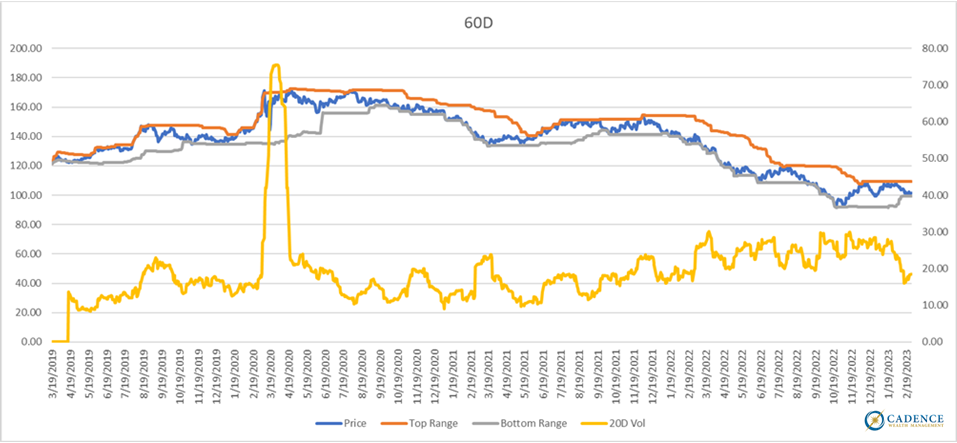
Below is the same analysis, but for the Nasdaq 100 (QQQ). Very similar story with price starting to move lower from the upper end of its 60-day volatility-adjusted price range.
QQQ:
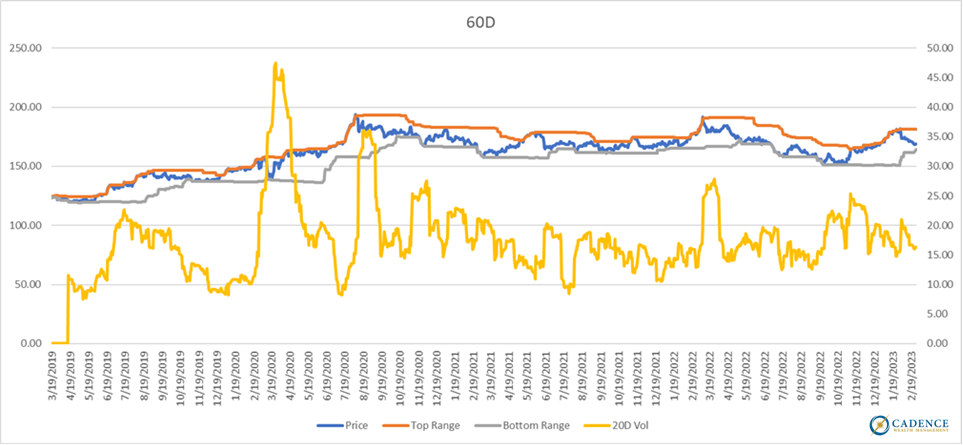
Now looking at the asset classes that historically have performed better during growth cycle downturns; let’s start with gold. Over the last two years gold has traded sideways after a large up move in 2020. Our view is that this price behavior represents consolidation as investors reconcile the ending of an historic stock market bubble. Gold reached a bottom in price last November and has been rising up until recently. If the bottom last November represents the beginning of a surge higher in gold prices, a pullback to the lower end of its price range would be entirely characteristic. As you can see below, we’re getting very close to that level now. We’ll watch this very closely over the coming days.
GLD:
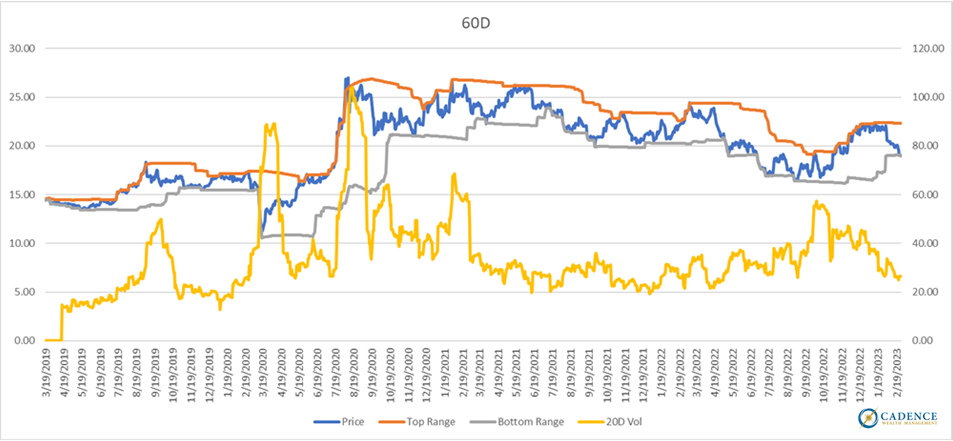
The chart below looks at silver. Same story as gold only it’s closer to the bottom end of its price level. If silver is to resume its uptrend, we would expect to see it move higher right around here. If not, there may be something else at work that needs to be taken into account.
SLV:
When we look at gold miner (GDX), we see the same story as silver. The pullback in recent days has been sharp, but within the range of what we’d consider normal price behavior given recent volatility. Similar to silver, if the time is right in this cycle for miners to shine, we’d expect prices to stabilize here. It’s important to note that throughout the price decline, volatility has declined as well (yellow line). This suggests an orderly decline and also makes institutional ownership more appealing; both positives.
GDX:
Finally, a look at treasuries via the ETF, TLT. You’ll notice a similar pattern here.
TLT:
The Distillation:
What does all this mean? In our professional estimation, it all adds up to suggest that we’re in the middle of a slowing economy that will likely slow further and lead to a continuation of the bear market in assets we saw last year. The recent bounce in stocks is probably over or near over, and given the amount of speculation in options markets recently, this transition back to lower stock prices could catch many off guard in terms of size and scope. Since almost all of the defensive categories we highlighted above have already corrected to the low ends of their respective price ranges, which isn’t unusual in a speculative stock market runup, it wouldn’t surprise us the least if prices stabilized and began to move higher from here. The downdraft in these categories has been characteristic of the price behavior in recent months and for investors and managers who are looking to buy good assets lower, it presents an opportunity which we have taken advantage of. Buy low, sell high only works if we do it, and February has given us an opportunity to do just that. Nothing moves in a straight line, and if it does, there’s a good chance it’s artificial, which like our perfect city road, may present problems down the line. Working with the Earth’s contours and natural landscape to build a more sustainable path to where we’re going is the wiser choice, and if we’ve travelled that bendy road enough, we can learn to appreciate the trip and enjoy the changing landscape and occasional surprises outside our window. Much like how February’s pullback in performance for more defensive investors represented an animal crossing the road ahead or a new bend we hadn’t encountered. This is all part of the journey, that if prepared for and reacted to properly (a controlled steer around the animal akin to buying assets on sale), can enrich the experience and make for a more successful trip. We have no doubt we’ll get where we’re going. Although it may not seem it, the bendy route is the best route.
Editor’s Note: This article was originally published in the March 2023 edition of our “Cadence Clips” newsletter.
Important Disclosures
This blog is provided for informational purposes and is not to be considered investment advice or a solicitation to buy or sell securities. Cadence Wealth Management, LLC, a registered investment advisor, may only provide advice after entering into an advisory agreement and obtaining all relevant information from a client. The investment strategies mentioned here may not be suitable for everyone. Each investor needs to review an investment strategy for his or her own particular situation before making any investment decision.
Past performance is not indicative of future results. It is not possible to invest directly in an index. Index performance does not reflect charges and expenses and is not based on actual advisory client assets. Index performance does include the reinvestment of dividends and other distributions
The views expressed in the referenced materials are subject to change based on market and other conditions. These documents may contain certain statements that may be deemed forward‐looking statements. Please note that any such statements are not guarantees of any future performance and actual results or developments may differ materially from those projected. Any projections, market outlooks, or estimates are based upon certain assumptions and should not be construed as indicative of actual events that will occur. Data contained herein from third party providers is obtained from what are considered reliable sources. However, its accuracy, completeness or reliability cannot be guaranteed.
Examples provided are for illustrative purposes only and not intended to be reflective of results you can expect to achieve.

