In the earliest days of the United States, tender and weakened from the 7 years of fighting to free itself from England, the debts acquired to fund the Revolutionary War had piled up with only troublesome methods of repayment left as options. Many who supported independence from England did so because they did not like paying the taxes England had levied, so raising money through taxes was not an attractive option for the newly minted Treasury. Issuing currency to pay those debts was also tricky, as with a mostly barter economy back then, any kind of liquidity injected into the system was feared to cause hyperinflation. Lastly, borrowing money to pay back money that had already been borrowed was only as successful as being able to find new lenders allowed. It’s not like the United States of the late 1700’s was seen as a safe bet for good reason, as the country did default on many of its early obligations.
In the end, dollars were issued leading to the predicted hyperinflation, and new debt was issued at interest rates that were attractive enough for lenders to be willing to take the risk on such a young, cash-poor, overly indebted nation. Both the hyperinflation as well as the relative scarcity of lenders resulted in interest rates rising fast enough to crush the value of outstanding US debt. The early days of the US Treasury are fascinating, extremely messy, and feel about a million years away from where the US Treasury activity is today. Yet, recent returns on 10-year US Treasury bonds have not fallen so quickly since Alexander Hamilton was begging for money. In fact, if 10-year treasuries don’t post a positive return this year, it will be the first time ever, even including those difficult early years, that their value falls three years in a row:
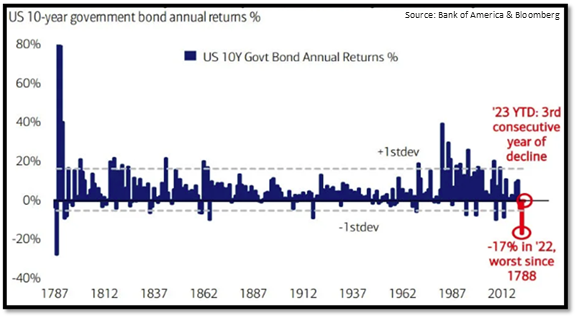
Whether you knew it or not, we have lived through the worst bond market since America was brand new. It is showing up in clients’ investment returns to an extent, but not to the extent you would think given how historically bad it has been out there. If the stock market suffered its worst loss since the Continental Congress, you would certainly be aware of it. So how can bonds have performed so badly without your knowing just how bad it’s been?
The Outperformance of Cadence Portfolios’ Conservative Investments
Most investors consider stocks to be the “risky” parts of their portfolios and bonds to be the “safe” parts. The more bonds you own versus stocks, the less volatile your portfolio usually is. The past few years, especially 2022, have challenged that assumption a bit. It turns out that safe bonds can perform like risky stocks if the environment is just right, and years of kicking the can down the road by keeping interest rates artificially low, injecting the financial system with liquidity that had to flow somewhere, and emergency pandemic funding, justified or not, have cooked up a perfect environment for both stocks and bonds to be over-valued by historic standards.
There are a variety of ways for investors to gain exposure to bonds and other forms of fixed income. They can buy individual bonds, either from government or corporate entities, they can buy exchange-traded funds that track any of the various bond indexes, and they can own fixed income mutual funds, to name a few. Over the past 12 years, Cadence portfolios have contained all of these options, as well as others, but as fixed income asset valuations crept ever higher, we have settled on mutual funds to handle the majority of our fixed income exposure. We have rounded out the conservative side of our portfolios with a tactical allocation toward alternative investments, which own assets other than stocks or bonds, or they do own stocks and bonds but are not managed as typical buy-and-hold assets. Using well-chosen mutual funds and alternative investments has spared our clients the vast majority of the historical pain experienced in the fixed income markets since August of 2020.
To illustrate just how successful this approach has been, consider the returns on conservative assets since the bond market peaked on August 4, 2020. Two of the returns being illustrated are the bond portions only of the Cadence 50/50 and the Cadence 0/100 stock-bond portfolios. Those are the green and dark blue lines in the middle of chart that are hugging each other quite closely. Included as well are the returns of the alternative assets sleeve we use in lieu of some of our bond exposure, which is the light blue line at the top. Lastly, we compare those results to a portfolio of bond exchange-traded funds, as well as to the iShares Core US Aggregate Bond Index, otherwise known as the AGG, which are the orange and red lines marching in near lockstep at the bottom of the chart:
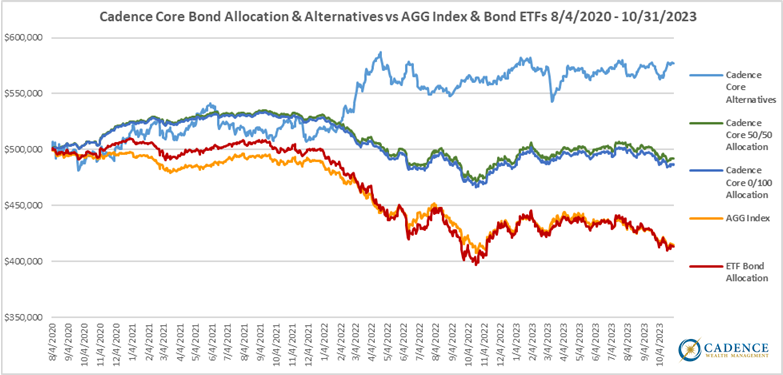
From August 4, 2020 through October 31, 2023, $500,000 allocated in the fixed income portion of our Cadence core portfolios would have lost between $8,000 and $13,000. That’s around a -1.5% to -2.5% loss. Compare that to the nearly $86,000 lost by the index itself, and the nearly $87,000 lost by a bundle of bond exchange-traded funds.
However, to get the true measure of how the conservative portions of Cadence core portfolios have performed over this stretch, you have to combine some of the returns of the alternative sleeve with the fixed income mutual fund returns, because as stated previously, we have diversified some of our risk reduction away from fixed income into alternative investments. When you add those together in the proportions we have them in our portfolios, the conservative portions of our portfolios have actually increased in value since August 4, 2020. Investing $500,000 in the two conservative portions of the Cadence core portfolios illustrated here versus investing in the AGG index itself or the ETF bond allocation would have resulted in the following gains and losses:
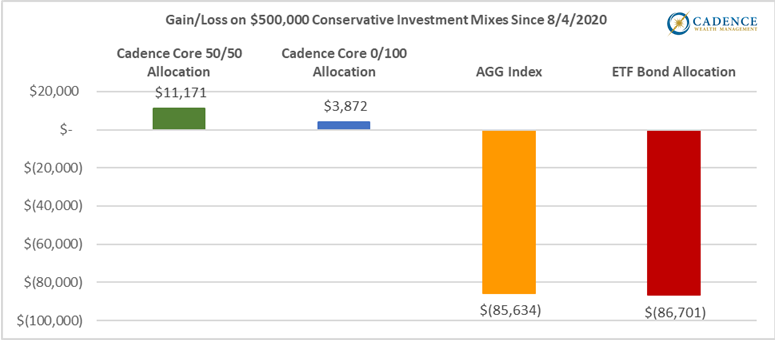
Those are some BIG differences. Of course, this is over the entire August 2020 – October 2023 timeframe, and the conservative portions of the Cadence core portfolios did have negative returns in 2022. However, those returns averaged around -4.5% versus the AGG index’s -13% and the ETF bond allocation’s -15%, so even in their one bad year, those Cadence allocations held up very well.
The comparison to the exchange-traded fund portfolio is especially noteworthy since those particular investments tend to be cheaper to own than mutual funds. While many investors have been shifting their conservative assets to ETFs, we have resisted the urge to do so because we believed that the navigation of an over-valued fixed income market was best left to those who have traded in and out of bonds for decades, those being the managers of our fixed income mutual funds. The benefits of that decision should be evident by now. Remember, it’s not always what you pay, it’s what you net that counts.
Holding Up Through Bad Times
The two main reasons why the conservative portion of our portfolios have outperformed the major indexes, a portfolio made up of ETFs, and, well, history, are because we used alternative investments for part of our conservative exposure, and because the mutual fund managers we are using did their jobs exceptionally well. For a number of years now, we have used a few flexible bond funds as the core of our fixed income exposure, trusting those professional managers to invest in the sectors of their world that would avoid as much pain as possible during bad times. We do use additional funds that target more focused areas of the fixed income market, and those funds have performed in line with their indexes, but the core of our conservative holdings shifted toward more favorable areas in time for us to avoid those historic losses.
The following chart shows the gains and losses of individual asset classes since the end of 2021 through October 31st of this year. More volatile investments like stocks are red lines, and less volatile ones like bonds are blue lines. You’ll notice that a lot of the blue lines did just as poorly as the red lines, which is a very rare occurrence. The core bond funds we use are the green lines, which you will see outperformed the majority of the bond classes. Those three investments, plus the alternative category, have the asterisks to show just how well our conservative assets held up relative to pretty much everything else. 7 of the 24 asset classes were still down over 20% as of the end of October, and 16 of them were still down 10% or more.
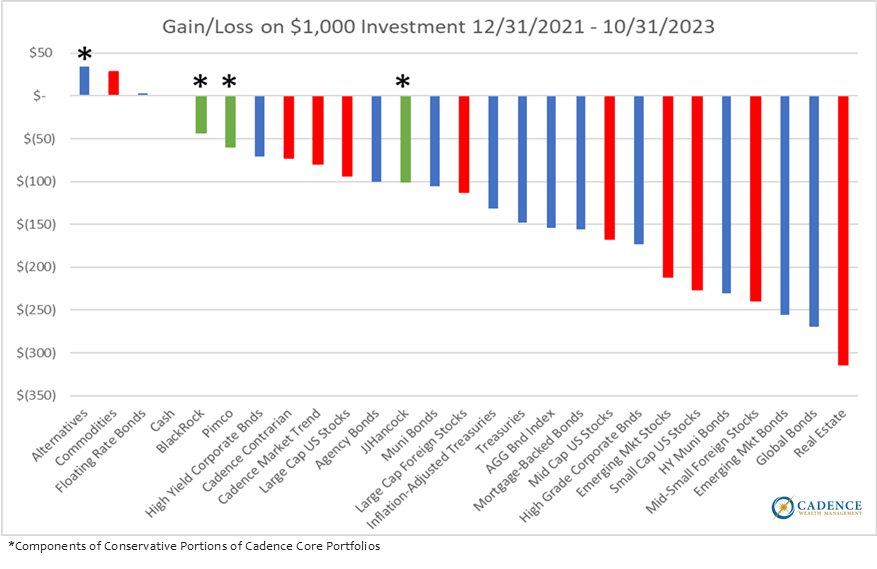
Of the volatile asset classes, only commodities have a positive return over the time period. Of the remaining growth-oriented investments, the Cadence Separately Managed Accounts are the two best performing after commodities, which is another reason why most clients’ losses were minimized to be just medium to small single digit losses, while the average asset class was down -14%.
You Can Win on the Downside Too
Still, most client portfolios are down since 2021, and even though it’s understandable with almost every single asset class in the red since then, it is difficult to feel like losing less on the downside is a win compared to how making more on the upside would feel. Just know that the math on the upside and the downside is the same: being down -5% on $1,000,000 as opposed to being down -15% leaves you with $100,000 more, just like being up 15% as opposed to just 5% would. Whether you win by 10% on the upside or the downside, you are still ahead by the same amount of money.
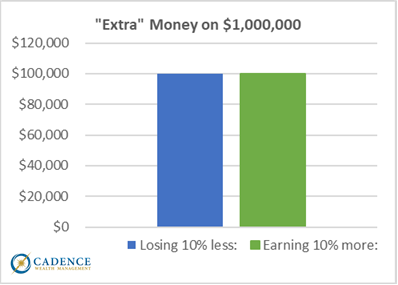
You will never see a less complicated chart, especially out of me. 10% is 10%, and the conservative parts of our portfolios, as well as the Cadence Separately Managed Accounts, have helped keep clients from losing more over a particularly difficult period.
Conservative Investment Outlook in the Near Term
We are in relatively uncharted territory with many, many asset classes today, both the historically volatile as well as the historically “safe”. Valuations and economic indicators, among other things, indicate we are probably not yet out of the woods when it comes to investment returns. These past few years showed us all that bonds are not always the safe investments we want them to be. Knowing this could be the case given just how extreme bond valuations had become, we at Cadence opted to look outside of the fixed income world to diversify away from the stock market risk carried in our portfolios by incorporating alternative investments. Additionally, for the fixed income exposure we did leave in the portfolios, we opted to use professional managers to choose which bonds to own and which to avoid, as opposed to using index-hugging options like exchange-traded funds. Since the earliest days of our country, our economy and our financial markets have survived many shocks, as we will continue to do. While not as dramatic as George Washington leading boats over the Delaware on Christmas night 1776 to attack a garrison of Hessian soldiers, our conservative investments have secured what should be considered a victory in relatively poor conditions, preventing losses from equaling the majority of the stock and bond investment categories over three very bumpy years.
Editor’s Note: This article was originally published in the December 2023 edition of our “Cadence Clips” newsletter.
Important Disclosures
This blog is provided for informational purposes and is not to be considered investment advice or a solicitation to buy or sell securities. Cadence Wealth Management, LLC, a registered investment advisor, may only provide advice after entering into an advisory agreement and obtaining all relevant information from a client. The investment strategies mentioned here may not be suitable for everyone. Each investor needs to review an investment strategy for his or her own particular situation before making any investment decision.
Past performance is not indicative of future results. It is not possible to invest directly in an index. Index performance does not reflect charges and expenses and is not based on actual advisory client assets. Index performance does include the reinvestment of dividends and other distributions
The views expressed in the referenced materials are subject to change based on market and other conditions. These documents may contain certain statements that may be deemed forward‐looking statements. Please note that any such statements are not guarantees of any future performance and actual results or developments may differ materially from those projected. Any projections, market outlooks, or estimates are based upon certain assumptions and should not be construed as indicative of actual events that will occur. Data contained herein from third party providers is obtained from what are considered reliable sources. However, its accuracy, completeness or reliability cannot be guaranteed.
Examples provided are for illustrative purposes only and not intended to be reflective of results you can expect to achieve.

