A feature of late-stage bull markets is the dominance of large cap companies. Coming out of recessions, small companies are seen to be more nimble, able to take faster advantage of the conditions present after the excesses of the economy have been painfully cleared. Before too long mid-sized companies start to come into their own, and then finally large companies start to swing around, like oil tankers making a big turn. The advantage being nimble has eventually gives way in a maturing economy to sheer scale – big companies tend to dominate later stages of the economic cycle, with the biggest of the big tending to dominate to an outsized degree at the very end of the cycle. Currently, just seven companies represent nearly 30% of the value of the S&P 500 Index. While that isn’t unprecedented, concentrations to that degree have been rare, and they have usually portended rough seas ahead.
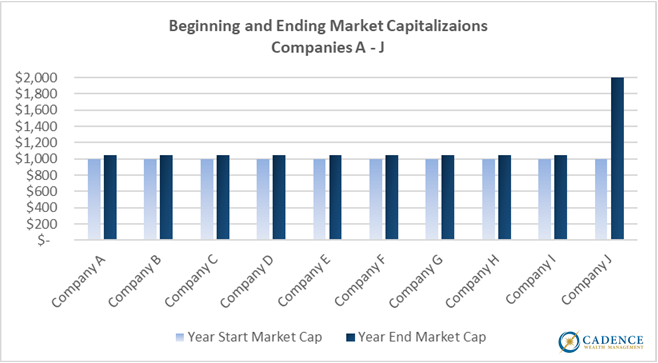
But before we dive too deeply into just how much a handful of companies are driving investment returns, here’s a simple primer on how to visualize something that is happening in the U.S. stock market. Consider an index comprised of 10 companies, Company A through Company J. At the beginning of the year they all have a market cap of $1,000, and they all represent 10% of the value of the index. As the year transpires, Companies A through I increase in value by 5% each, however company J increases in value by 100%. In this scenario, a couple notable things have happened as a result. The first is that of the 15% return generated by the index, Company J is responsible for nearly 70% of it:
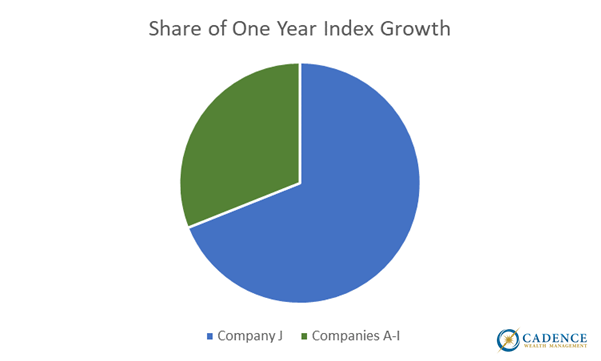
Of the $1,450 growth in the index for this one year, Company J contributed $1,000, with the other nine companies contributing only $50 each. You can see just how much Company J’s contribution to this year’s growth dominates.
Secondly, at the end of the year each company no longer represents 10% of the index: Company J has grown to be 17.5%, with all the rest falling to around 9% each.
Going forward, Company J’s returns will have more of an impact on the change in the index value than any of the others, for better or worse. If next year the first nine companies lose -15%, and Company J loses -70%, as can easily happen to a company with the ability to double in value like J did year one, then the index will lose -25% and half of that loss will come just from J.
Which brings us back to today. Unlike our simplified version of an index with just 10 stocks with one dominant, the S&P 500 has 500 companies, but if you think that means it is unlikely to be dominated by a small number of stocks, you would be mistaken. Right now, just seven stocks represent around 27% of the value of the index: Apple, Microsoft, Alphabet (Google), Amazon, Nvidia, Tesla and Meta (Facebook).

Just like our simplified example, these seven stocks, referred to by some as the “Magnificent Seven”, have an extremely disproportionate impact on the S&P 500 Index’s returns. Just how large are these seven companies? When you compare the size of these companies as measured by market capitalization (stock price multiplied by number of shares of stock outstanding), their combined stock market value is the equivalent of 5 affluent countries’ entire stock markets!
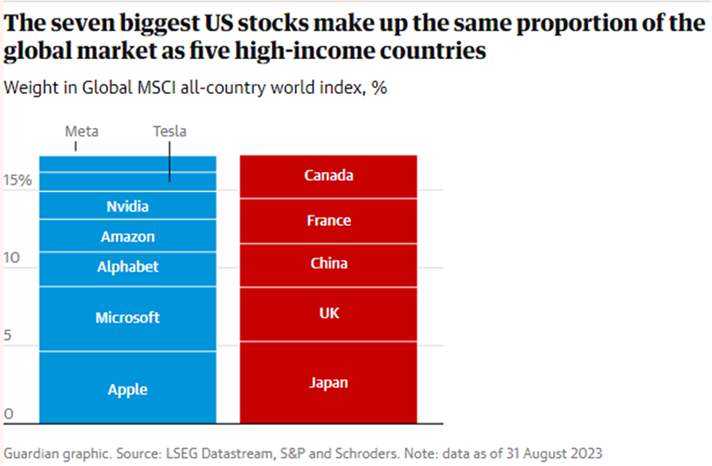
These seven companies are as influential to the world’s financial markets as five whole countries. Apple and Microsoft alone have as much impact on the world’s stock returns as all of Japan and England. That sounds more than mildly insane, but does it really matter?
When times are good for these companies, as 2023 has been, then it sure does matter. Consider that a portfolio of just these seven stocks owned in relative proportion to their value to the S&P 500 Index would have increased by nearly 90% so far this year, and consider the S&P 500 as a whole has increased by around 24% this year, then you can already guess that these seven are responsible for an outsized proportion of what the index has returned in 2023.
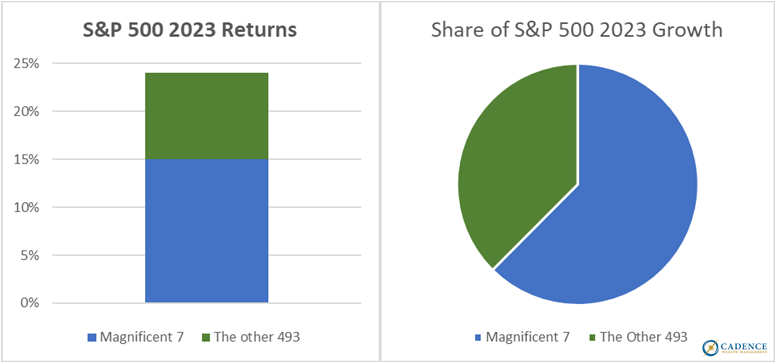
If the earlier example of one fictitious company dominating a 10-company index seemed unrealistic, welcome to the reality where seven real companies are dominating a 500-company index. Subtract these seven companies, and the S&P 500 Index is up around 9% in 2023. A number of investment sectors are up around that much this year, so it really is just these seven companies that make the S&P 500’s performance special this year. The dominance of these seven companies has mattered in 2023, as without them the index would be having a good but not great year, but what would happen if these seven companies did worse than the other 493, especially much worse?
No one actually knows the answer to that, but we all have a general sense that like how these seven companies pull the index up higher than it would otherwise go in good years, they would push the index down lower than it would otherwise go in bad years. In 2022, the proportionate portfolio of these seven stocks was down around -39% at its low point, with the index being down around -25%. As you are expecting by now, these seven stocks were the cause of an outsized proportion of that -25%.
What no one knows is, what might happen in a historically bad year? 2022 was a bad year for the S&P 500 Index, but it wasn’t a historically bad year. The average 2022 maximum loss of those seven stocks was -55%. Their all-time average maximum loss is around -76%. What happens in a year with historically bad lows, where investors look at just how expensive these seven stocks have become and sell them in droves? What happens when people move to cash in their 401(k) accounts and these seven stocks represent an outsized proportion of everything being sold? How badly might these seven pull the index down?
Historically, when an index’s value gets concentrated in a handful of holdings, no matter what sector that index is in, no matter what country’s stock exchange that index represents, and no matter when it occurred over the last 100 years or so, eventually returns turned ugly. The massive drawdowns of the Tech Bubble were exacerbated by a similar concentration in a handful of stocks, and there was a similar concentration in 2007 before the Great Recession’s October peak. In general, when financial markets are dominated by a small number of players, they become more volatile. The benefits diversification provides, smoothing out some of the bumps along the way cease to work when diversification yields to concentration. If you want to know why one wouldn’t instead just own these seven, very expensively valued stocks then read last month’s Cadence Clips, specifically the small piece entitled “Why can’t I invest in hot stocks or markets, then just get out before they crash?” in the Q&A section. Every moment in investing is both similar and different to previous markets. The outsized performances of these seven stocks are in part driven by the hope that artificial intelligence will be leveraged to further their profits, which may or may not happen. However, with history as a guide, previous periods of concentration also had their reasons to be optimistic yet it was the concentration itself that ultimately led to historically bad stock market index crashes. If this time is different, it would be a first.
Editor’s Note: This article was originally published in the January 2024 edition of our “Cadence Clips” newsletter.
Important Disclosures
This blog is provided for informational purposes and is not to be considered investment advice or a solicitation to buy or sell securities. Cadence Wealth Management, LLC, a registered investment advisor, may only provide advice after entering into an advisory agreement and obtaining all relevant information from a client. The investment strategies mentioned here may not be suitable for everyone. Each investor needs to review an investment strategy for his or her own particular situation before making any investment decision.
Past performance is not indicative of future results. It is not possible to invest directly in an index. Index performance does not reflect charges and expenses and is not based on actual advisory client assets. Index performance does include the reinvestment of dividends and other distributions
The views expressed in the referenced materials are subject to change based on market and other conditions. These documents may contain certain statements that may be deemed forward‐looking statements. Please note that any such statements are not guarantees of any future performance and actual results or developments may differ materially from those projected. Any projections, market outlooks, or estimates are based upon certain assumptions and should not be construed as indicative of actual events that will occur. Data contained herein from third party providers is obtained from what are considered reliable sources. However, its accuracy, completeness or reliability cannot be guaranteed.
Examples provided are for illustrative purposes only and not intended to be reflective of results you can expect to achieve.

