We’ve long scoffed at the term “risk-free” when referring to U.S. government bonds as there have been countless times when they’ve fluctuated in value well beyond what most would consider “risk-free”. Volatility tends to show up in anything that’s traded freely, in markets, by humans. However, the greater than 40% decline in long-dated U.S. government bond prices since the summer of 2020 has completely obliterated any remaining notion of U.S. sovereign debt being devoid of risk. There are really important lessons and implications to this bond implosion. First, the lessons:
Lesson #1
No investment is risk-free. Anything that trades on markets and fluctuates in value can lose a lot of value in a short period of time if conditions align. Guaranteed investments like some annuities are only as safe as the institution that backs them. Bank accounts and CDs, although FDIC insured, could hang in limbo between the time a bank fails and the time the government steps in with FDIC remuneration. In fact, one could make the argument that given how underfunded the FDIC program is, the massive amount of money they would have to print to make depositors whole in the event of a widespread financial system failure could result in loss of savings due to inflation created in the process. If there’s any benefit in putting savings somewhere, there is also risk.
Lesson #2
The longer a heuristic or collective belief endures, and the more widely followed, the greater the cumulative risk over time. Stocks in the 90’s, real estate in the 2000’s, and bonds over the last two to three decades are recent examples. In the 90’s, investors thought the internet would change the rules of the stock market and finance and result in endless stock market gains; the Nasdaq subsequently lost 84% of its value. In the 2000’s, many thought real estate values couldn’t fall for the simple reason that the supply of land and homes was limited and finite. This belief was shattered after double digit declines shook property markets worldwide and catalyzed the global financial crisis. And most recently, the relatively modern (last 40 years) belief that a well-diversified portfolio of stocks and bonds can weather any storm has been proven false. Investors over the last three years have been reminded that stocks and bonds, both financial assets, can move in the same downward direction at the same time. Most relevant to this lesson, the more people depended on that not happening, and the length of time they were depending on it, is directly proportional to the magnitude of the event that eventually proves that belief misguided.
Lesson #3
Timing. Although we knew government bonds were far from risk-free and could be vulnerable to large losses, we didn’t expect to see those losses rack up most acutely during an economic contraction from late 2021 to present. Our thinking was that we would see interest rates rise most sharply (and thus bonds fall) after a broader stock market collapse and economic slowdown which would usher in more economic stimulus and a corresponding economic recovery from much lower price levels. The more robust economic growth and corresponding monetary growth and inflation would help to support higher interest rates after wiping the slate of much of the excess that currently exists. That didn’t happen. Instead, the “risk-free” government bond market broke first while the stock market and broader economy remain teetering on the precipice. Because low probability events sometimes play out, it’s crucial to make sure the response to them when they do doesn’t get you into more trouble as an investor. The question we’re asking ourselves now is, what are the implications of this bond market collapse and how do we position for it?
Implications
Either the rise in interest rates and corresponding bond market collapse is an isolated and temporary event or it’s not and will have larger knock-on effects. For it to be the former, rates would need to come down significantly and rapidly from here in order to minimize damage to the broader markets and financial system. Although that would be nice for all but those with abundant savings looking for a reasonable rate of interest, it isn’t likely to happen without some sort of fundamental reason. That has us leaning toward the latter scenario of higher rates and bond losses serving as a domino that gets the whole line of them toppling in short order. In summary format, here’s why we feel that way:
1) Rates on 30-year fixed mortgages are near 8% and auto loans are slightly above that. This, along with other factors has doubled the cost of ownership over the last 2-3 years, which not only hits demand for purchases, but also must necessarily bring the price of those assets down by nearly half in order to keep affordability level. The process typically goes, higher rates lead to fewer buyers, fewer buyers lead to fewer things sold and lower corresponding profitability. If prices are elastic, then price must eventually come down sufficiently to restore adequate buying demand. The end result is that if rates stay high, the economy gets hit, and asset prices fall in order to repair it.
2) As the economy slows and corporate profitability gets hit, layoffs begin to accelerate. This leads to both a repricing of stocks as well as potential liquidations of stock portfolios by those affected by corporate layoffs. This scenario could lead to a reversal of the passive investment phenomenon that has helped to buoy markets over the last 13 years and facilitate significant losses for U.S. stock market indexes going forward.
3) As the economy weakens further, banks will find it difficult to locate credit-worthy borrowers at 8-9% interest rates. In addition, because they have taken significant losses already on their own loan books as well as their treasury holdings, they will be reluctant to issue new loans at much lower rates or extend credit to anyone without pristine collateral and credit history. This phenomenon perpetuates the economic slowdown and financial market corrections, but also sows the seeds for a reduction in interest rates, since:
4) When banks can’t or aren’t willing to lend to private credits, they park their money in U.S. government bonds. Some “safe” interest is better than no interest, and this demand for bonds across the banking system pushes prices higher and interest rates lower. There is no consideration for whether the government can pay back the debt in 10 or 20 years, the size of the budget deficit, or the level of inflation. Rates fall as a purely mechanical function stemming from the needs of the banking system. It’s for this reason that we are not panicking away from bonds at this point, but rather, keeping a level head. When demand from banks throughout the acute phase of this economic contraction runs its course, we’ll reevaluate whether treasury bonds make sense.
The weakness in demand associated with an economic slowdown tends to put downward pressure on interest rates so long as the banking system remains stable. Between this and the system wide treasury purchases from banks, we have reason to expect that most interest rates should come down in the months and quarters ahead. The higher they are, the more dominos get tipped over, and the more dominos get tipped over, the greater the downward pressure on government bond rates and those linked to them. Thus, if and when economic activity further contracts, we should see higher U.S. government bond prices and lower rates shortly thereafter.
Another implication of the recent carnage in bond markets is within financial institutions. Pensions, insurance companies, and banks all carry significant amounts of high-quality bonds, and thus have taken severe hits to their balance sheets. The solvency and liquidity of these institutions bears careful watching going forward. There are any number of potential knock-on effects that could stem from fires popping up among these large, systemically important financial institutions. The longer-term implications among pensions seem easier to assess. Already underfunded pension funds that are paying out benefits regularly will certainly be no stronger nor more capable of delivering promised benefits after taking 40% losses on their “safest” holdings.
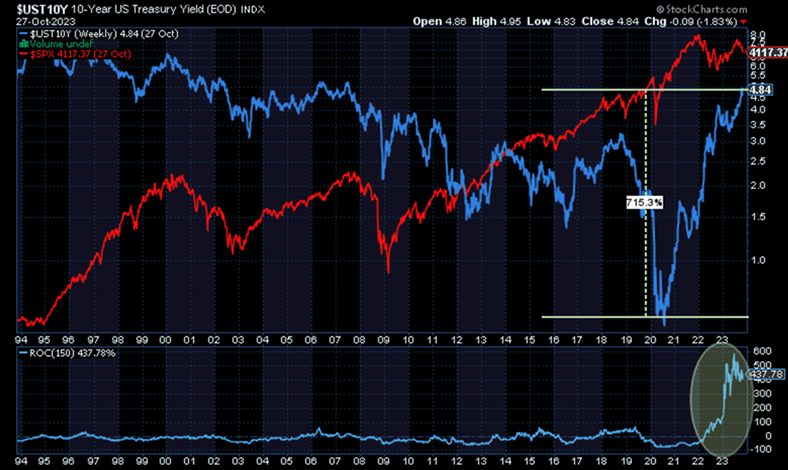
The Magnitude of the Rise
Below is a chart of the 10-year U.S. government bond rate going back to 1994. What’s immediately obvious to the naked eye is the magnitude of the rise in rates over the last three years. If rises have a moderating effect on borrowing and subsequent purchases and investment within the economy, then the last three years represents a complete slam of the brakes. You’ll also notice the three-year rate of change in the 10-year rate on the bottom right of the chart. There has been nothing like it in modern history.
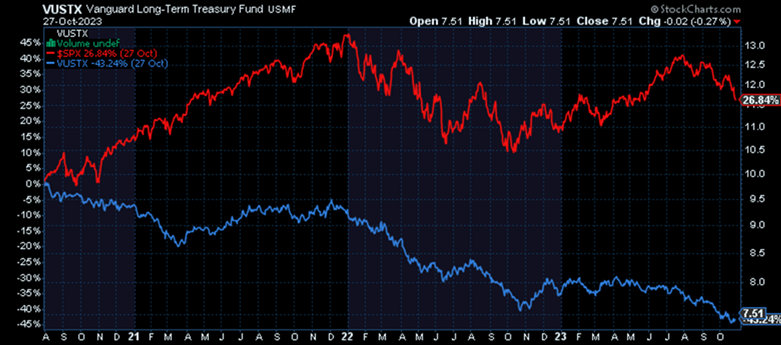
Below, you can see the difference in performance between the S&P 500 (red) and a long-duration U.S. government bond fund (VUSTX, in blue) over the last three years. Like I mentioned earlier, this is one of the biggest curve balls we’ve ever been thrown both in terms of the extent and timing of the bond market destruction, and it’s equally perplexing that stocks have stayed so resilient throughout it all. In an investment world that hasn’t made sense for more than a decade, I suppose we’ll chalk this up as par for the course. It’s yet another series of market swings that can easily confuse, scare, and trip up investors into making bigger mistakes. Our interpretation of the chart below, from where we currently sit on the far right of it, is that the events that led to large losses in bonds will catalyze an even greater descent of the red line (large U.S. stocks) in the near future. In the process, the blue line (treasury bonds) could be a strong performer for the duration of the economic slowdown.
Equity Risk Premium
When the return a company can earn through profit outweighs what one could get on safer short-duration U.S. government bonds, that excess is referred to as risk premium. The thinking goes that risk premium must be large enough to compensate investors for the extra risk taken in pursuing higher returns, and of course, every investor is different in terms of the premium they would require. When that risk premium turns negative, what it means is that companies are earning less in profit (in the form of yield) than the safer option. Because corporate earnings yield is a function of both stock price and earnings, this is typically because stock prices have been pushed higher faster than a company has been able to grow its earnings. Thus, a negative risk premium typically reflects excessive investor euphoria and the prospects of lower returns over time than could be attained from safer options.
As we see in the chart below, periods of negative risk premium tend to precede market tops and subsequent declines. At the very least, they indicate that safer bonds might be the better option going forward. Note the negative earnings yields prior to the last two market crashes along with where it stands now.
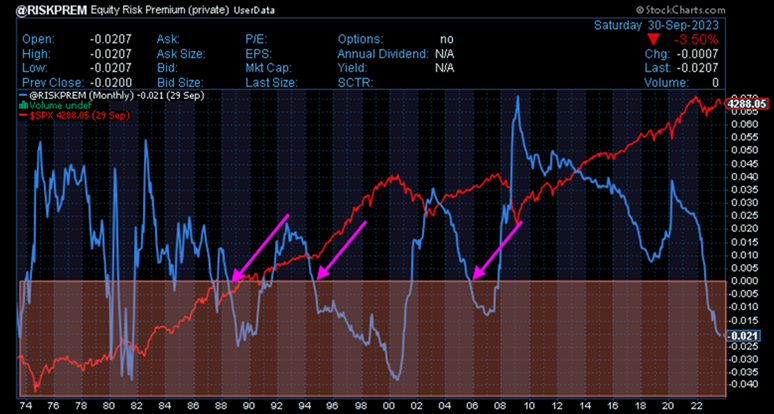
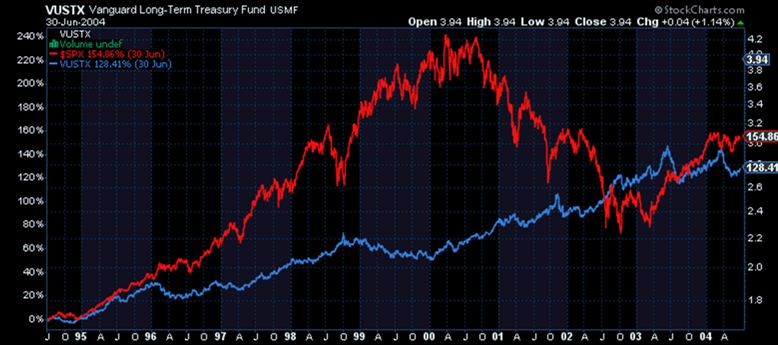
The three purple arrows above mark the last three times the earnings yield went below 0%, where the profit return from investing in the stock market didn’t outweigh the risk when compared to safer 6-month U.S. government bonds. Below, we look at what those points in time led to in terms of S&P 500 (red) and long duration U.S. government bond returns. The first chart below looks at the timeframe when the earnings yield went negative in 1988. What we find is that investing in bonds would have been practically equal to investing in stocks for the next 7 years or so. There was even a point where we would have been well ahead of stocks in 1993.
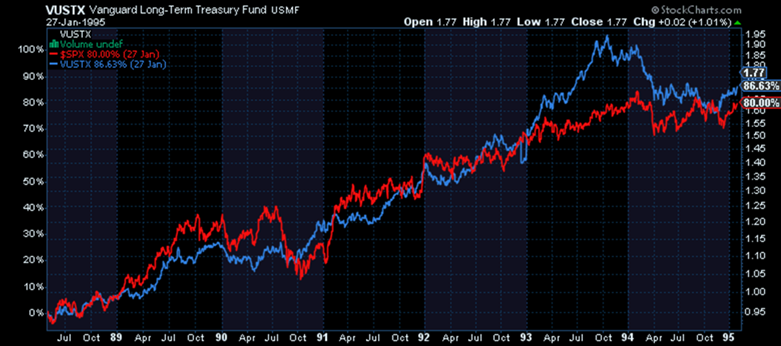
Below, we see that even in the biggest bubbles in U.S. history at the time, when stocks stayed expensive and earnings yields inverted for way longer than even the savviest investors expected, eventually by 2003, the return on bonds matched that of stocks.
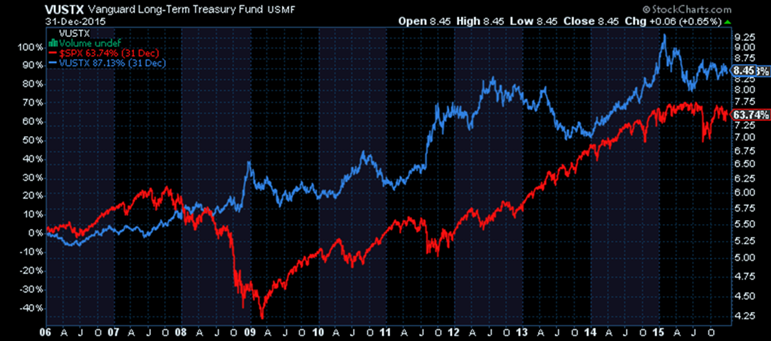
In a slightly different example (chart below), at the point of inversion in 2006, bonds outperformed stocks for at least ten years going forward rather consistently.
In all three of these examples, we see that even longer duration bonds can match stocks when stocks get too expensive relative to their earnings and the yield paid by safer bond options. Our sense is the same will be true going forward. It’s important to note, however, that short-term bonds are an equally viable option in this environment. A six-month or two-year government bond would have virtually no default risk and despite any short-term fluctuation, would return principal at the end of the term. The biggest downside to investing in bonds or CDs with too short a duration is the risk that rates will be lower when they mature and need to be reinvested. We refer to this as “reinvestment” risk, but when thinking about the host of other potential investment perils, it pales in comparison. Rates are competitive again across most maturities, especially in a world filled with risk.
The Right Type of Risk at the Right Time
Although the old Wall Street myth about stocks and bonds moving in opposite directions has been recognized as such over the last three years, one of the cyclical relationships that still holds up is that of financial asset (stocks and bonds) and commodities (real assets). Sure, they can move in the same directions over shorter periods of time, but their long-term cycles tend to oppose one another. The chart below shows strong commodity cycles in green and strong financial asset cycles in red. You’ll notice that when one is doing well, the other isn’t. When investors are obsessed with stories, leverage, and paper assets, they tend to ignore the boring stuff that makes the world go and life happen. By extension, companies tend not to invest as much into making more of them. Then, for some host of unpredictable reasons, the winds shift. Investors become less obsessed with stories, fast riches, and paper, and more focused on real stuff. There’s also a bit of a shortage since companies weren’t “wasting” effort on their procurement and production. Supply is low, demand rises, and voila. A new cycle begins. Money flows in a new direction.
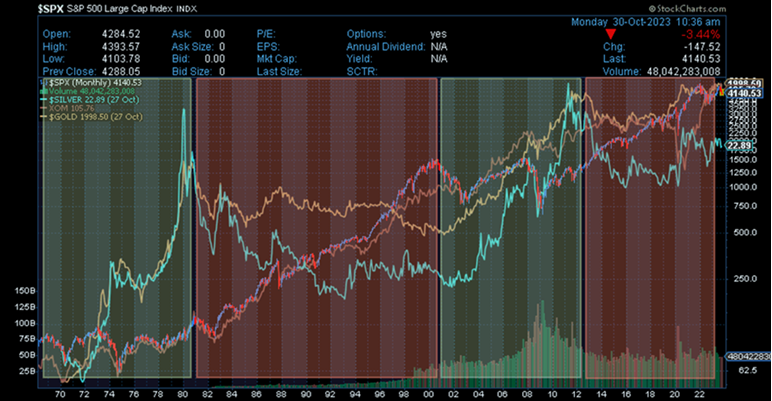
Given everything we talked about thus far, our thinking is that the big red chunk on the right side of the chart above that represents the biggest stock bubble of all time and an underperforming commodity sector, is primed to switch over to green. The economic brake of higher rates and the market disruptions it’s likely to cause have all the ingredients necessary to pop frothy markets. The bond bubble was the first to deflate, with stocks likely next in line along with real estate, as the dominos begin to tip from one to the next. Money will frantically look for new homes. Our thinking is that, despite plenty of noise and confusion, it will find them in treasury bonds of varying maturities (over the short to intermediate term) and commodities, sooner for the precious metals, but eventually in most.
The important thing to remember though, is that there are times when all the education, rationale, and common sense in the world prove useless when events play out in chaotic, complex ways. It’s in these times that we have to be ready for the low probability event, any possible outcome, and react in a way that helps us more than hurts us. In an environment where dominos fall, we’ll be looking for opportunities we didn’t anticipate all while managing risk along the way. It’s like the old saying goes, we can’t always control what happens to us, but in almost all cases, we absolutely can control how we react. Good investors aren’t necessarily soothsayers. They are however, very adaptable to changing conditions, decisive under stress, and adept at turning lemons into lemonade. The bond route was a falling domino few anticipated would happen when it did, including us. Let’s see what opportunities it brings for our investment portfolios going forward.
Editor’s Note: This article was originally published in the November 2023 edition of our “Cadence Clips” newsletter.
Important Disclosures
This blog is provided for informational purposes and is not to be considered investment advice or a solicitation to buy or sell securities. Cadence Wealth Management, LLC, a registered investment advisor, may only provide advice after entering into an advisory agreement and obtaining all relevant information from a client. The investment strategies mentioned here may not be suitable for everyone. Each investor needs to review an investment strategy for his or her own particular situation before making any investment decision.
Past performance is not indicative of future results. It is not possible to invest directly in an index. Index performance does not reflect charges and expenses and is not based on actual advisory client assets. Index performance does include the reinvestment of dividends and other distributions
The views expressed in the referenced materials are subject to change based on market and other conditions. These documents may contain certain statements that may be deemed forward‐looking statements. Please note that any such statements are not guarantees of any future performance and actual results or developments may differ materially from those projected. Any projections, market outlooks, or estimates are based upon certain assumptions and should not be construed as indicative of actual events that will occur. Data contained herein from third party providers is obtained from what are considered reliable sources. However, its accuracy, completeness or reliability cannot be guaranteed.
Examples provided are for illustrative purposes only and not intended to be reflective of results you can expect to achieve.

