What we have been experiencing in financial markets the last few years has been truly mind-boggling. We would venture to say that nobody could have come even remotely close to forecasting the combination of events that have played out since the global financial crisis in 2008. Above average U.S. stock market growth with below average economic growth? No way. Foreign stocks being worth less ten years later? Not likely. More than $10 trillion in sovereign (governmental) bonds yielding less than 0%? To be clear, this means you pay the government to lend them money. That would be ludicrous. It will never happen.
Well, all these things have happened and depending on your individual circumstances, either you benefited from these seemingly random outcomes or you’ve been hurt. If you’re a U.S. stock investor exclusively, you’ve won – for now. If you bought primarily foreign stocks, you’ve lost – for now. A hugely divergent set of outcomes given that both involve investing in stocks. If you’re a retiree looking for safe interest on your principal, a wage-earning employee, or an investor looking for better long-term opportunity, it’s been a tough stretch. From a historical perspective, we’ve rarely seen times where things have been so out of whack across markets or the society as a whole for that matter. They are related. Record levels of wealth inequality are related to irresponsible central bank policy that rewards those with access to capital. And those with access to cheap capital have in turn impacted financial markets through corporate share buybacks, speculation, and outright money flows. Of course, there are many other factors, but the point is that the things we’re experiencing in the world are linked. The pendulum has swung to the extreme. As we’ve learned, there are varying levels of “extreme”, but in the end the pendulum always swings back. As Brent Johnson, a fellow wealth manager has said, “you either believe in magic, or you believe in math”. As we’ve mentioned before, math always prevails. Fortunately, human nature repeats and therefore, outcomes rhyme. We can learn from this if we care to.
Past Extreme Pendulum Swings
From a historical valuation standpoint, the U.S. stock market is “full pendulum”, which is to say there’s never been a time when stocks on a broad number of measures have been this expensive. Not 1929. Not 2000. Never. Full pendulum. And although it’s been quite magical to behold, the math will be anything but. We’ve referenced Japan a number of times in our letters because what it experienced in the 70’s and 80’s led to stock valuations that are very similar to those in the United States today. Additionally, their story since the bursting of that bubble presents additional lessons that could help guide our investment decisions and expectations going forward. Here’s a look at the Japan bubble leading up to Christmas Day 1989.
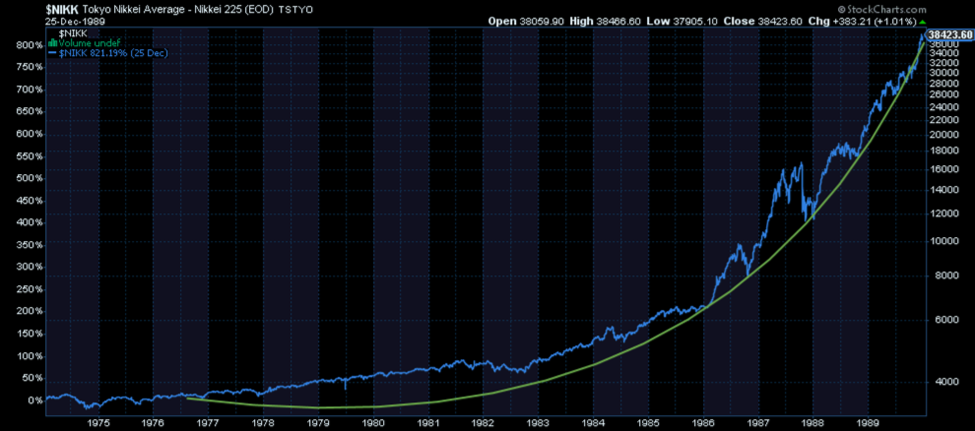
Nearly 15 years of steady stock market growth can be seen in this chart, but you’ll notice the shift into high gear around 1986. This is what we refer to as going parabolic, which is a common marker of euphoric or “bubble” market environments. Once this happens, it’s no longer about economic or corporate fundamentals or even common sense, but rather the fact that the market’s going up quickly and can’t seem to lose. Greater fool theory takes hold, which means as long as you as the speculator (no longer you as the “investor”) can sell your shares to somebody else at a later point who’s more foolish than you, you’ll keep buying. What breaks this process is anybody’s guess, but when sentiment shifts, it really shifts. Here’s a look at Japan since then.
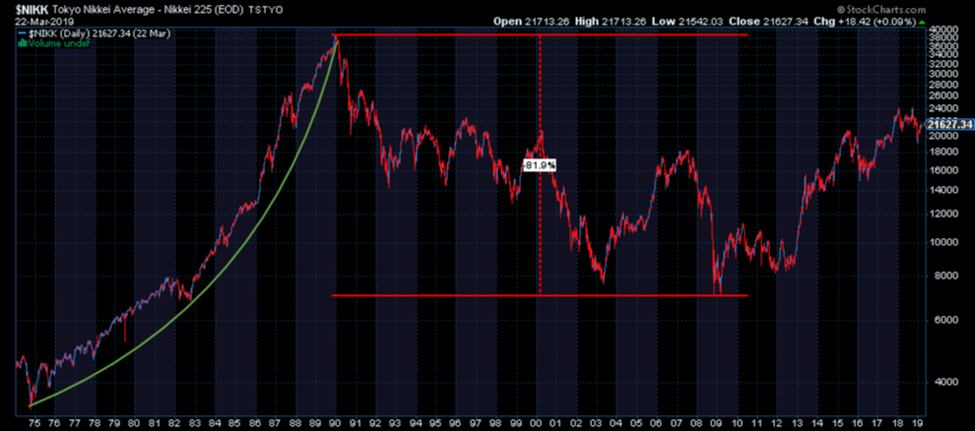
The Nikkei 225 average fell more than -80% from its peak and hasn’t made its way back since. Almost 30 years of losses for those who bought into the “magic” toward the end of the show. Before moving on from this chart, please think about a couple of key points. First, our markets are about as expensive as the Nikkei in 1989. For those thinking it’s impossible to lose money in stocks beyond a holding period of a few years, study this chart. Second, for those thinking central banks can keep stock markets propped up indefinitely, please also study this chart. The Bank of Japan has been extremely loose with their monetary policy since the mid 90’s. They’ve pinned interest rates near 0%, have bought government bonds in large quantities and within the last few years have even bought vast amounts of Japanese exchange traded fund shares. In short, they’ve done just about everything they can do and their markets still sit significantly lower than they were in 1989. They’ve also had numerous recessions and have suffered from anemic economic growth. Over long periods of time, central banks cannot change math. If anything, they only serve to make matters worse. Another topic for another day.
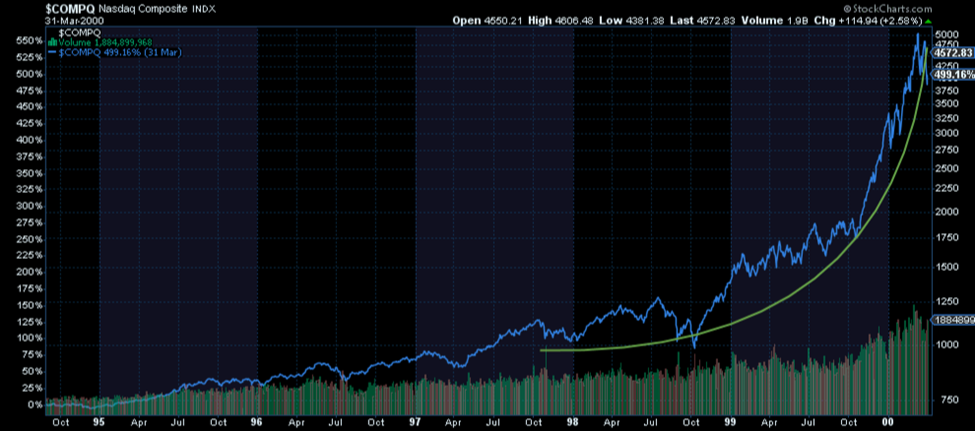
The next bubble reference, and we’ll speed this up to rapid fire pace so that we don’t lose you, is the Nasdaq in the 1990’s. Epic indeed. Notice the same parabolic rise in the last couple years as with Japan.
Here’s what ensued.
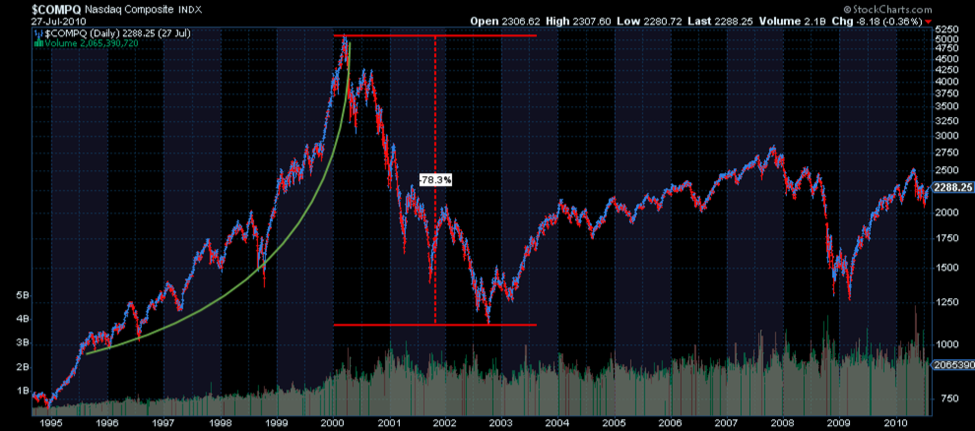
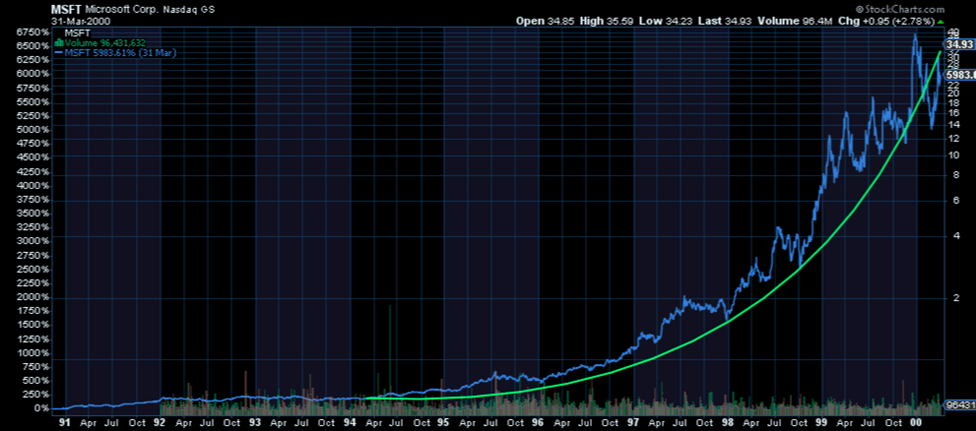
Again, around an -80% loss from top to bottom and in this case more than ten years of sustained losses. The Nasdaq of course is an index comprised of many individual companies. If it was able to accelerate toward the end of its rise, then surely there were constituent stocks that rose even faster. Take Microsoft for example. It was one of the premier technology companies at the time and essentially owned the PC market with its Windows operating system. You couldn’t use a computer without Microsoft profiting from it. So how investors expressed this enthusiasm was to bid up the price of the stock at a rate well beyond that of actual profit growth. The stock price grew faster than the company ever could. Perversely, investor enthusiasm tends to ramp up and peak just as the law of large numbers starts to hamper a company’s ability to maintain the high growth rates that got investors excited in the first place. A recipe for disaster? Here’s a chart of the enthusiasm around Microsoft.
And here’s a chart showing the pendulum swinging the other way.
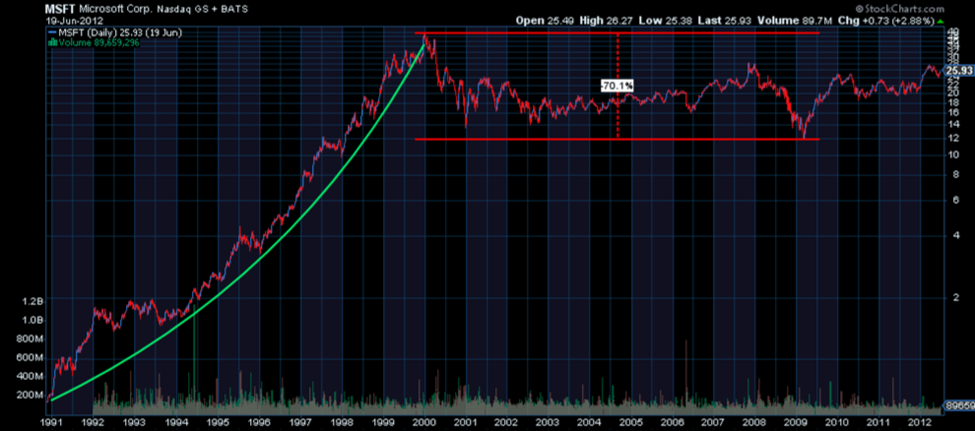
Not all the growth was undone, but a long period of stagnation ensued after investors experienced a -70% drop from the peak. The important point here is that Microsoft continued to grow as a company throughout this period. There was never anything wrong with the company, only the stock. It simply got too expensive and had to take a ten-plus year “timeout” in order to let the fundamentals catch back up. Either way, investors buying in toward the end of its epic run underperformed for quite some time.
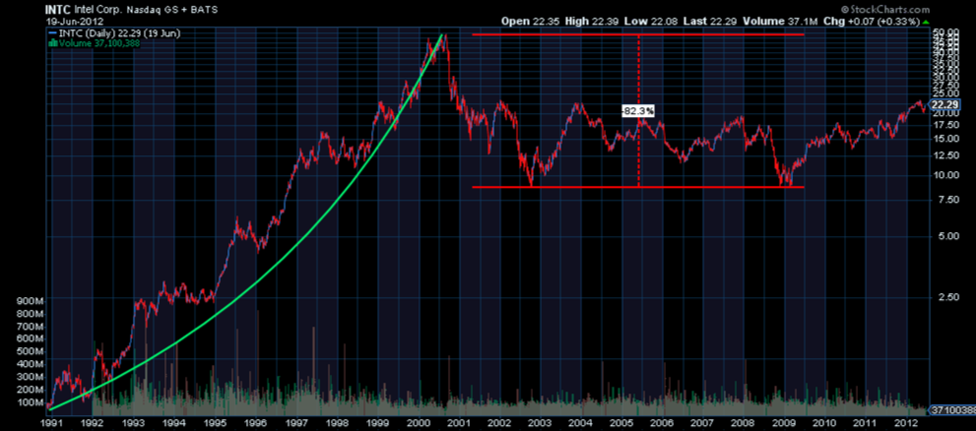
Another high flying and exciting tech company in the late 1990’s was Intel. It’s experience on both sides of the pendulum swing were almost identical. As with Microsoft, Intel prospered throughout while the stock sat dormant. Company versus stock. Two different things.
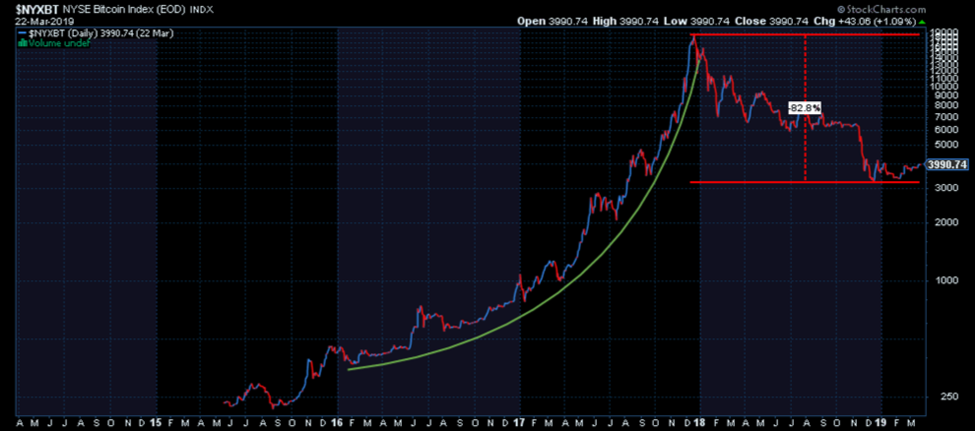
And the final investment we’ll mention from the more recent past is Bitcoin. It’s not that hard at all to remember late 2017 when Bitcoin was priced at over $19,000 and CNBC seemed to be promoting it every day. We took calls on it. Clients were starting to ask about it. Not when it was priced at $1,000 or $5,000, but when it was toward its height. This is the way it tends to work. People take note and start talking about something when the story gets so unbelievable that it becomes a good story. This creates the parabola toward the end of a price rise as investors rush in to capture those gains. Explain what Bitcoin is or how it works? Not important. All that matters is that it went from $1,000 to $19,000 in short time, creating fast wealth for some, and could do the same for me. Well, for the last 15 months or so, Bitcoin has fallen over -80% in price. Where it goes from here is still up for debate, but it will all come down to whether we’re looking at a Google or a Netscape type of situation. Although Netscape was one of the first internet browsers in the 1990’s, it ultimately failed as other companies carried the torch forward. Bitcoin’s ability to carry the cryptocurrency torch forward from here will determine whether it’s a deal at current prices or has much, much farther to fall. We have our guesses.
Current Examples of Extremes
If valuations were extreme five years ago (which they were), they’re even more extreme now. Not only are there many more individual companies within the market presenting parabolic increases in price, but it’s being more clearly reflected across the indexes as well. First, the Nasdaq.
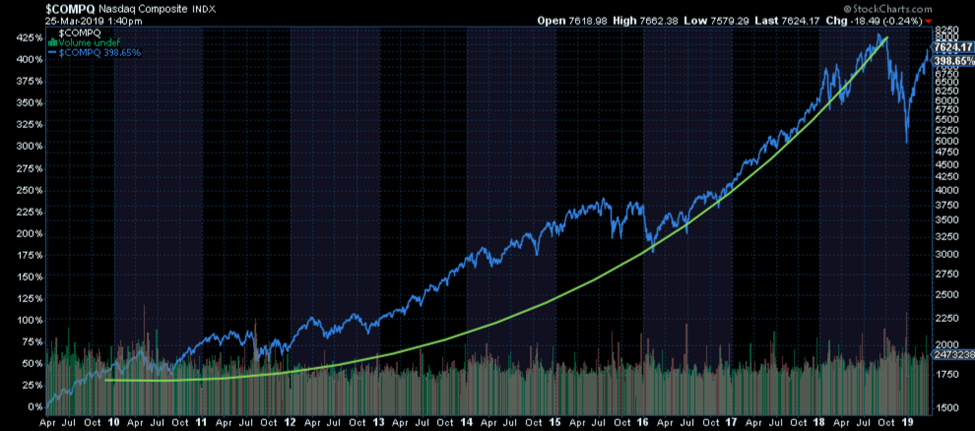
The sharp rise coming into 2014 was outdone in 2016 and 2017 due to a flood of new money from Central Banks and a narrative around a new president that made it easy to believe in the impermeability of financial markets. This created the textbook price acceleration we’ve been discussing. Out with logic, in with magic.
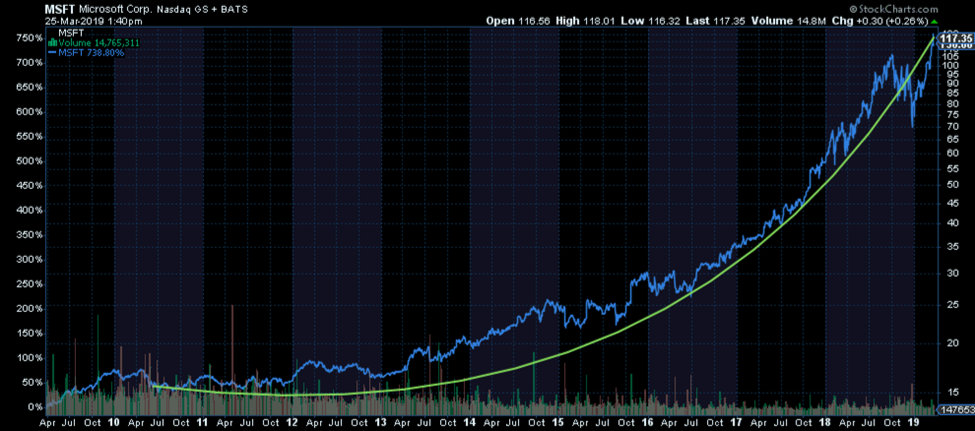
We’ve also seen this dynamic across much less exciting companies than the phenomenon has typically been limited to in the past. Stocks whose stories easily created a cult following such as the tech companies of the nineties or the Tesla’s and Netflix’s of today were usually the parabolic risers. Not anymore. Here’s Microsoft giving it another go.
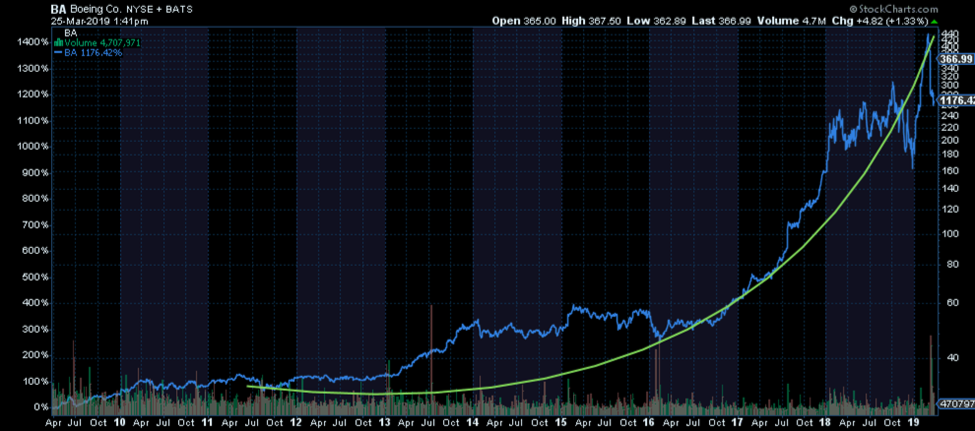
And Boeing. A historically rather boring cyclical company.
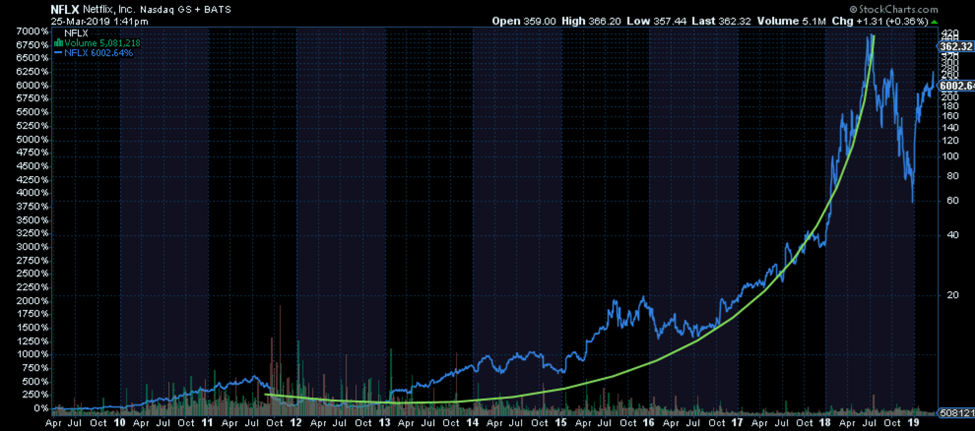
Nike is among the other non-tech, less exciting companies experiencing a parabolic price increase recently. There are lots of them. It truly is broad-based in nature. The final chart we’ll share showing the true magnitude of the issue will be one from a more tech-oriented cult stock company – Netflix.
What’s clear from looking at today’s market is that many investors and market participants believe in magic. Parabolas abound in many stocks across many sectors of the markets. From a historical perspective, this represents the final few degrees of swing for the pendulum. The question always is when does it begin swinging back?
Clues Momentum May Have Changed
There’s a reason the phrase “keep it simple stupid” exists. Often times as humans we find ourselves digging deep into the weeds looking for answers when the biggest clues are staring us right in the face. As investment managers, we’re no doubt guilty of this at times. The big clue in this case indicating the pendulum swing in the other direction may already be underway is the breakdown in the parabolic rises across many investments today – some of which we’ve looked at here. Whatever it was that caused investors to rush in the last couple of years reversed in the fourth quarter of last year. Trends changed and as of now, markets and most of the stocks that comprise them remain below their prior highs. Supporting that simple observation is some data from the weeds.
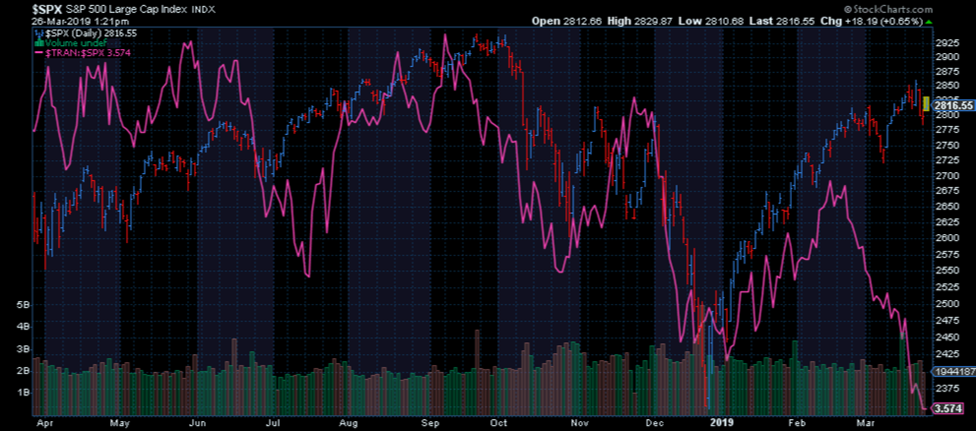
Although markets have risen sharply this year, not all stocks are participating. The transportation sector began lagging the S&P 500 badly in mid-February as seen below in pink. They seem to be telling a story more consistent with the bulk of economic data that’s been rolling in over the last few months – the world is slowing in a synchronized manner. Trade and commerce are down, not up.
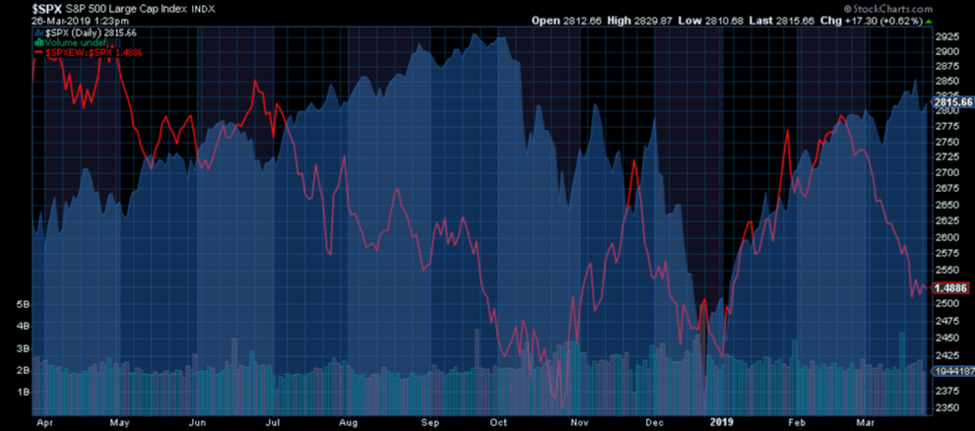
In addition, when looking at the average stock in the S&P 500 via the equally weighted index, it’s clear to see that the largest of companies tend to be doing most of the heavy lifting since about the same time – mid-February. The rally has thinned out considerably and is no longer broad-based (represented by the red line below.)
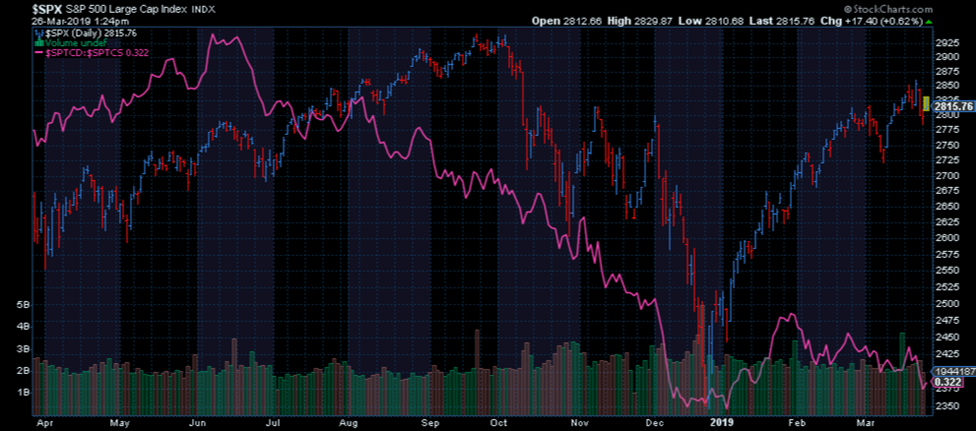
Another potential clue corroborating the fragility of the current bounce is the fact that discretionary stocks are fairly dramatically underperforming consumer staples. In an expanding economy and traditional growth-oriented bull market, discretionary stocks tend to outperform the more boring and defensive consumer staples. That’s not happening now.
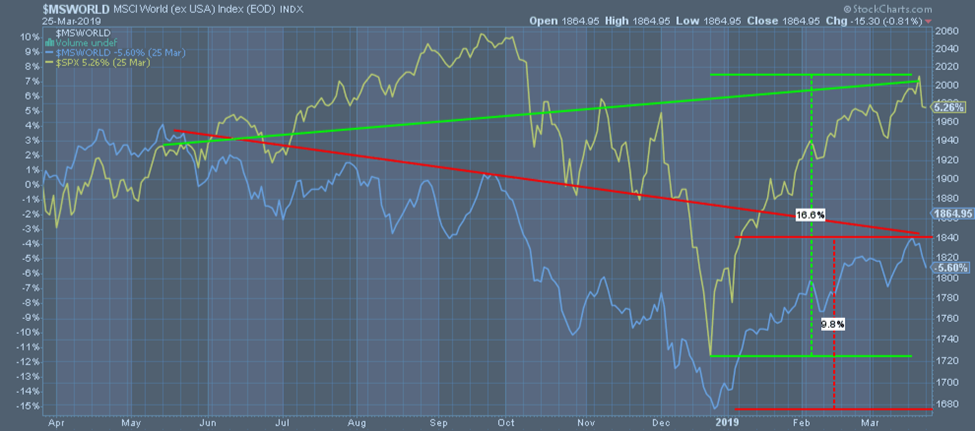
Finally, global stocks which we mentioned earlier have lagged U.S. stocks badly the last 10 years, have not recovered from the fourth quarter 2018 selloff nearly as much as U.S. stocks have. The U.S. continues to outperform over long, intermediate, and short timeframes, which to us indicates that the capitulation likely required for this diverging performance trend to reveres still lies ahead. In short, when markets truly bottom, we should see international stocks begin to outperform. The chart below doesn’t show anything of the like.
As we discussed last month, stock market performance is highly correlated to the growth and profit cycles in the short to medium term. Long term, they are highly correlated to longer credit and demographic cycles. Most of these cycles are either already trending lower or beginning to. This may help to explain why international stocks already peaked in January 2018 and why we’re seeing so many divergent clues of the same peaking process in U.S. markets currently. Lakshman Achuthan of the Economic Cycle Research Institute talks about slowing or contracting economic growth as a condition that opens a window of vulnerability for recessions and adverse capital market events. In other words, bad things tend to happen more frequently against the backdrop of slowing economic activity, which is exactly what we’re facing now.
So, when we take a few steps back from the excitement of the most recent stock market bounce, hot stock of the day, or most recent statement from the swath of central bankers, what we see is quite sobering. Markets have gone truly parabolic in their ascent. Parabolas are bubbles. They reflect the greedy and irrational part of human behavior that cares not about an investment for the long term, but only about making money in the short term. This is showing up in more individual stocks across more sectors than is usual and it’s being reflected in the broad indexes and valuation in general. Very little is truly cheap and much is beyond expensive. We have ample historical precedent to know that this is not something that can last forever. It never does. In the end, either you believe in magic or you believe in math. Invest accordingly.
Take-Aways
- We tend to see parabolic price increases toward the end of large price moves. They all end the same way. Big losses if not total losses.
- There is tremendous divergence across markets and segments of the market at this point, indicating the recent bounce from December lows may be on borrowed time. These aggressive bounces are commonly observed within downward trending markets.
- When looking at economic cycle data, recent stock market price action and valuations, as well as a host of internal divergence we’re witnessing at the moment, the weight of evidence suggests U.S. stocks have begun their correction phase. This isn’t to say factors can’t present themselves or change providing an additional short-term boost, but any effect would likely be temporary. In the end, magic must succumb to math.

