Change is a funny thing. It’s one of the only constants in life; something we can depend on. Whether we’re talking about the four seasons, aging, health, or quality of life, we can depend on change to shuffle things up on us before we have a chance to get too comfortable. The optimist would say “discomfort and stress lead to growth”, while the cynic might prefer to resist change or deny that it lies ahead. As humans, most of us are the latter. Recency bias has us believing the present can continue on at least until tomorrow, and when taken one day at a time, why does tomorrow ever have to be “that day” where things begin to change? Regardless of our brains’ biases that serve to keep things simple and us comfortable, change eventually happens. In financial markets, we couldn’t be more well-conditioned for complacency than we are right now, more than 12 years into a bull market and hopefully on the tail end of a global pandemic. If financial markets were the four seasons, we’d have just skipped a winter or two with investors positioned such that we’ll never have another winter again – but things change.
In our January 2021 piece entitled “More Cowbell!”, we talked about how the growth and inflation cycles would likely continue to accelerate through the middle of this year at which point they would be up against increasingly difficult prior-year comparisons. That acceleration in both cycles has played out and we now stand at the point where further expansion becomes harder to come by on an annualized basis. When looked at alone, however, the mathematics of base effects tell us little about what may be coming tomorrow or the next day. For context, we need to consider other information in assessing whether or not we may be up against a potential turning point for financial markets in the coming days or weeks. What we know is that the potential for change right around now exists. To evaluate the probability of that change occurring, we must look for uniformity of signal; a singularity of message.
The Cycles Themselves
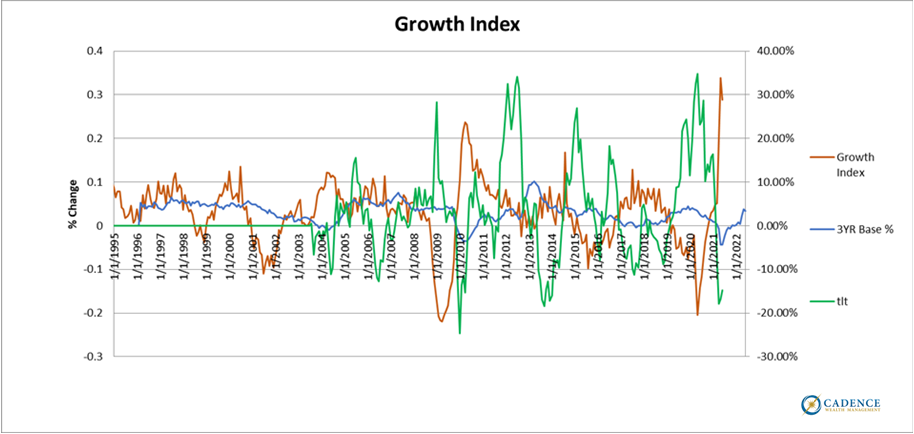
When it comes to financial markets, things tend to get dicier when growth is slowing. What we can clearly see by looking at the orange line in the following chart is that since spring of last year, growth has been accelerating at a breakneck pace and has recently reached year over year rates of change not seen in more than 25 years, and markets have recovered along with the economy over this period of time. However, after such a rapid recovery in growth, and given the increasingly difficult base effects from one year ago that we’re now up against (blue line), it wouldn’t be hard to imagine the rate of growth beginning to slow from here on out – which would appear on this chart as the orange line moving back down toward the zero bound. If we look closely, we can see that over the last month this has already started to happen. Whether it continues remains to be seen, but all trends have to start somewhere.
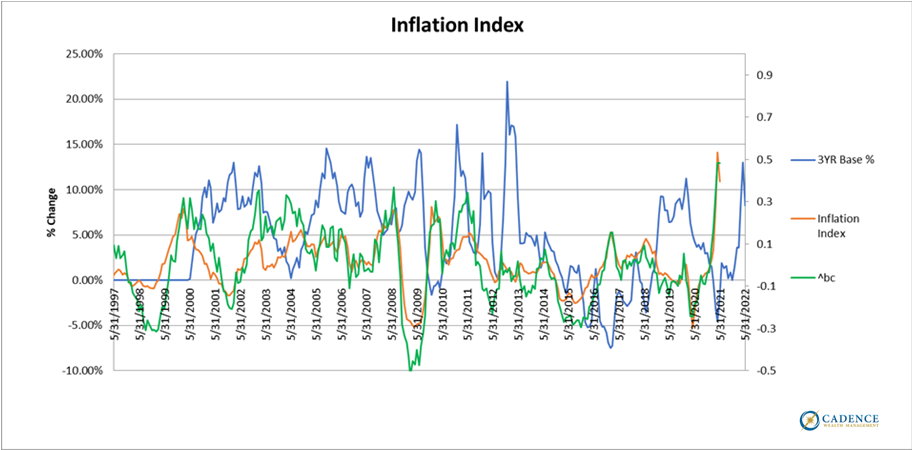
When we look at the inflation cycle in the chart below, we see a similar dynamic; a quick recovery from last year’s springtime lows to a more than 25-year peak in the one-year acceleration rate. We also see an increase in the base effect over the next month or so, but some reprieve for a few months thereafter. What this might suggest is that inflation could have a harder time peaking and rolling over mathematically than growth. We’ll look to commodity prices to confirm this (the green line below), but should inflation stay persistently high, our thinking is that we’d prefer to own asset classes and sectors of the market whose prices are either directly related to inflation or stand to benefit from it. On the other hand, if we see inflationary pressures abate along with growth, we’d favor a more defensive positioning.
Qualitative Considerations for Growth and Inflation
Continuation of Accelerating Growth
→Momentum – Simply more of what we’ve seen over the last year or so.
→The end of unemployment assistance supplements – As government benefits end over the next few months (starting now in some states), a wave of workers will re-enter the workplace. This could boost growth further.
Risks to Growth
→Covid risks re-emerge. The Delta variant poses a real risk to the re-opening we’ve seen globally.
→Delta variant notwithstanding, the reopening surge wanes. Pent-up demand and spending has run its course.
→Unemployment assistance supplements expiring. If workers cannot be absorbed into the workforce, this could affect demand and spending.
Continuation of Accelerating Inflation
→A Covid re-emergence could disrupt supply chains.
→Dramatic money supply growth and deficit spending over the last year boosting demand for fewer goods.
→Commodity price increases taking time to work through the system.
→The trend even pre-Covid was for higher inflation indicating inflationary pressure could be about more than a supply shock or re-opening phenomenon.
Risks of Disinflation or Deflation
→The re-opening helps to reinstate supply chains, supply catches up to demand, and prices stabilize. If supply catches up while demand falls due to growth slowing, then prices could fall at a faster rate.
→Demand for goods and services falls sufficiently to arrest rising prices regardless of supply (assuming of course supply doesn’t fall faster).
→The weight of global debt levels keeps prices from rising much farther. Since debt burdens are already extremely high, there is limited capacity for additional debt to fuel additional demand.
Valuation
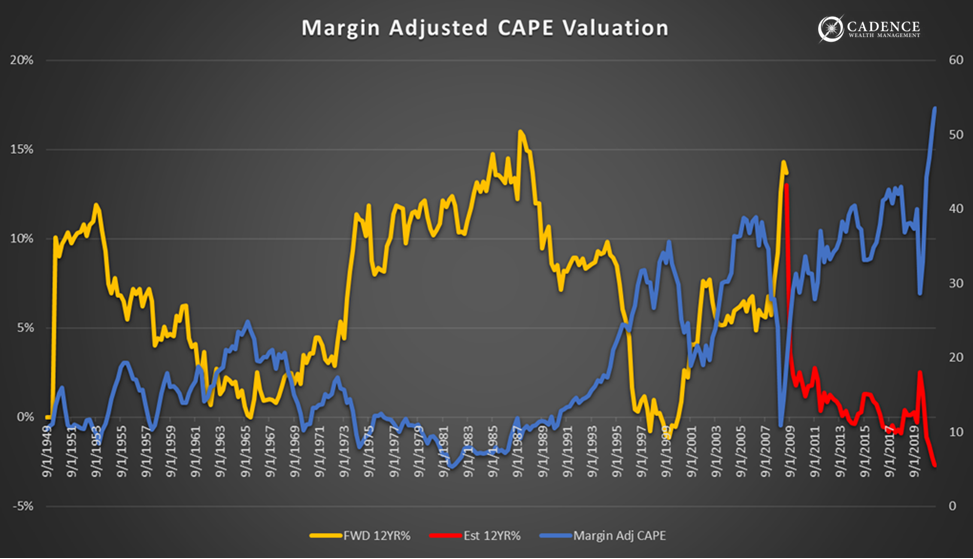
One of the factors that investors should always consider is the price they’re paying for an “investment”. A cheap, attractive price gives one the luxury of being able to ride out unfavorable market events with a reasonable amount of certainty that prices should recover at some point in the not-so-distant future. Paying too high a price means that investors should be much more aware of and averse to unfavorable economic and market conditions down the line as a meaningful retreat back to fair prices could result in being underwater and carrying losses for a very long period of time. With that in mind, as we can see below, when we look at the level of the stock market (S&P 500) relative to ten years’ worth of inflation-adjusted corporate earnings (the Robert Shiller CAPE), and then adjust them to reflect an average level of profit margin, it’s clear that stock market valuations are almost literally off the chart (blue line). The yellow line measures the actual 12-year annualized returns investors realized at every point along that valuation cycle, and the red line reflects anticipated 12-year returns going forward as valuations revert back to an average level. As you can see, return prospects going forward for the stock market are amongst the worst in the last 70 years and it’s worth noting that the red line factors in a dividend rate of 1.5% and valuation not dropping below average. One would also be keen to remember that we don’t get a historical average without spending time both above and below it. Investors therefore should be braced for the possibility that markets actually perform worse than what we’re outlining below over the coming 12 years – which as of now is worse than -2% annually for 12 years.
Dry Tinder (Margin Debt)
With the potential for a growth slowdown ahead and markets at extreme valuations, it’s also important to consider what factors could contribute to selling pressure in the event that markets begin falling rather than rising – rising of course being what most investors have been conditioned to expect. There are two variables that are front and center for us. The first is the dominant trend in passive investing where investors and managers don’t take an active role in selecting securities that are deemed most attractive. Rather, an investment is made in an index, which requires that the majority of purchases be made in stocks or securities that are most strongly represented within that index. This creates a feedback loop where the largest positions in an index get more and more of future investment flows regardless of valuation. The bottom line is that flows drive prices higher so long as those flows continue. Should something happen in the economy or markets causing flows to stop or worse, move in reverse, what could develop is a similar feedback loop in the opposite direction and with more rapidity. Fear always plays out faster and more acutely than greed or complacency. With this in mind, investors may be best served owning stocks, securities, or entire asset classes that the masses don’t own much of.
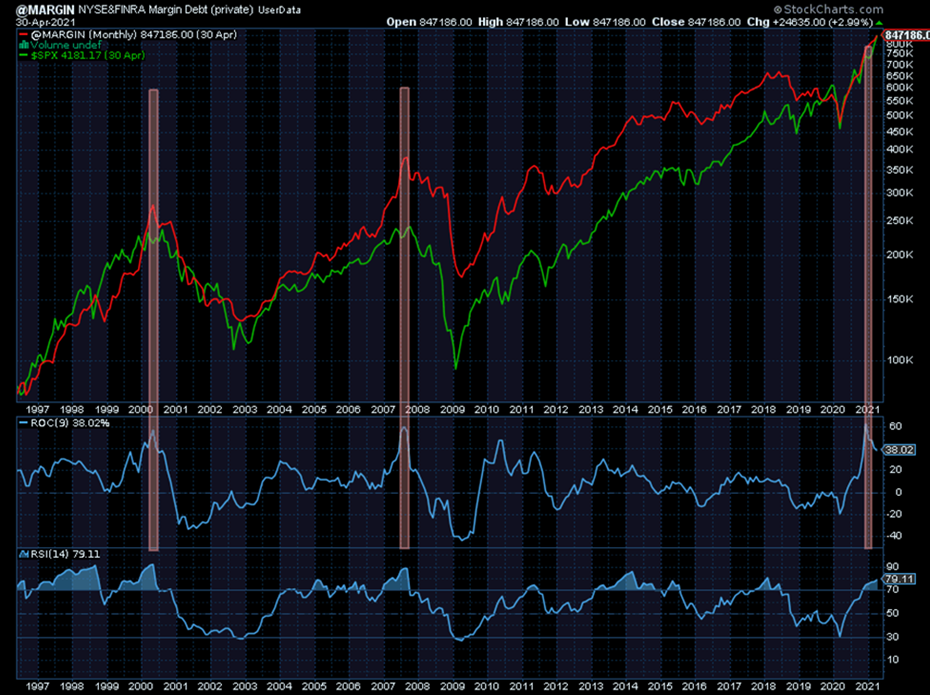
The second variable is brokerage account margin debt. The red line in the chart below shows how much debt exists within retail brokerage accounts that has been used to purchase additional securities. We’ve talked about this in a recent Clips piece; the more investments are purchased with borrowed money, the faster losses accumulate. This can accelerate selling when markets drop as investors either choose to or are forced to limit losses. In the lead-up to the last two bear markets, we saw the accumulation of margin debt grow at rates exceeding 40% over a nine-month timeframe. It’s often toward the end of bull markets, once investors have been sufficiently conditioned to ignore risk, that they throw caution to the wind and borrow money to maximize gains. We have recently witnessed this same behavior in margin debt growth, as you can see from the blue line labeled “ROC” in the chart below.
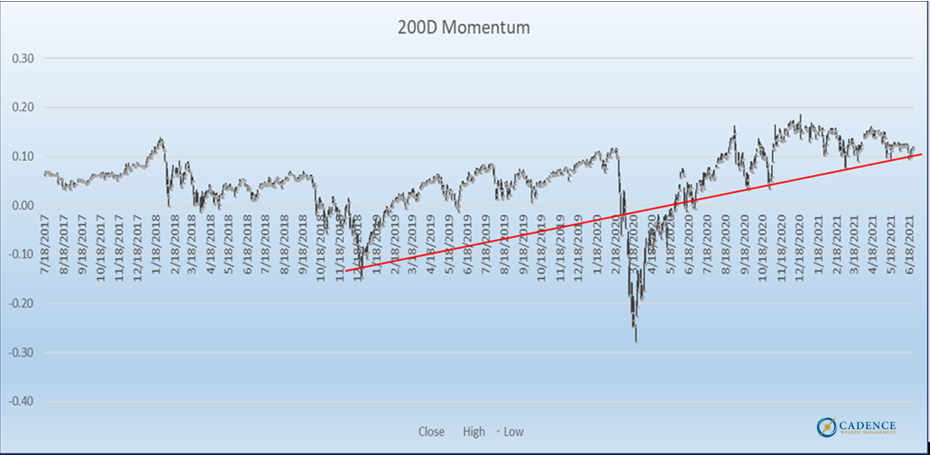
S&P Momentum
As it happens, the S&P 500 is at a very key level from a price momentum standpoint. Michael Oliver of Momentum Structural Analysis specializes in momentum analysis and uses a fairly straightforward approach to measuring it. He looks at price in relation to various moving averages to get a different picture of what’s happening relative to recent trends rather than simply price behavior alone. It’s price through a different lens if you will. What we can see from the chart on the next page is that the price of the S&P 500 relative to its 200-day moving average is currently just above a trendline that connects a number of prior lows. This is what’s referred to as support, where if broken, could signify a meaningful change in behavior or direction. Simply put, if the S&P 500 closes ~1-2% below current levels, the uptrend would be broken. This is something we’re keeping a close eye on.
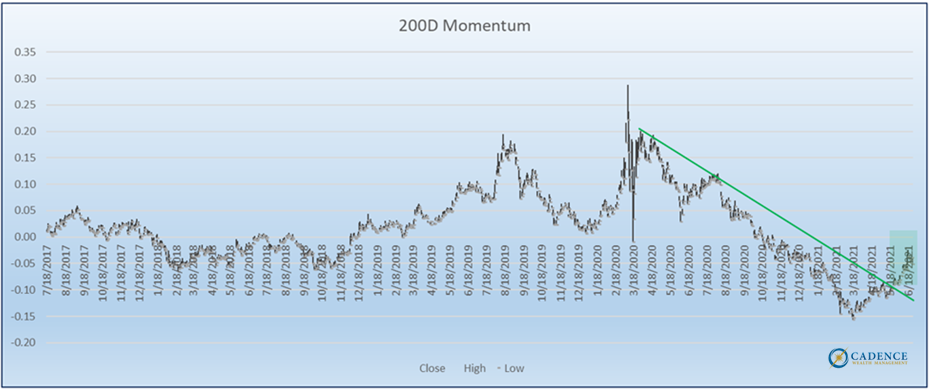
Safety Bid (Treasuries)
Using the same analysis of TLT below, a long duration U.S. Treasury bond ETF, we can see that the downtrend that lasted for over a year appears to have broken over the last month or so. The momentum behind what’s often considered a safe-haven investment has shifted in character from negative to positive. This is notable in light of everything we’ve talked about up to this point. Large investors may be shifting positions from riskier asset classes to the safety of bonds in anticipation of change.
Safety Bid (Gold)
Gold is an asset that investors tend to pay attention to when inflation is destroying the purchasing power of paper currencies, when deflation is destroying the value of financial assets, or when the price of it has simply gone up for long enough that’s it’s hard to ignore. The point here is that there are multiple scenarios where gold could perform well, which is what can make it an important diversifier inside an investment portfolio. However, when we see the strong possibility of either of the first two scenarios playing out, that’s when it can be particularly important not only to consider an investment in gold, but to monitor its price action for clues as to the timing of such developments.
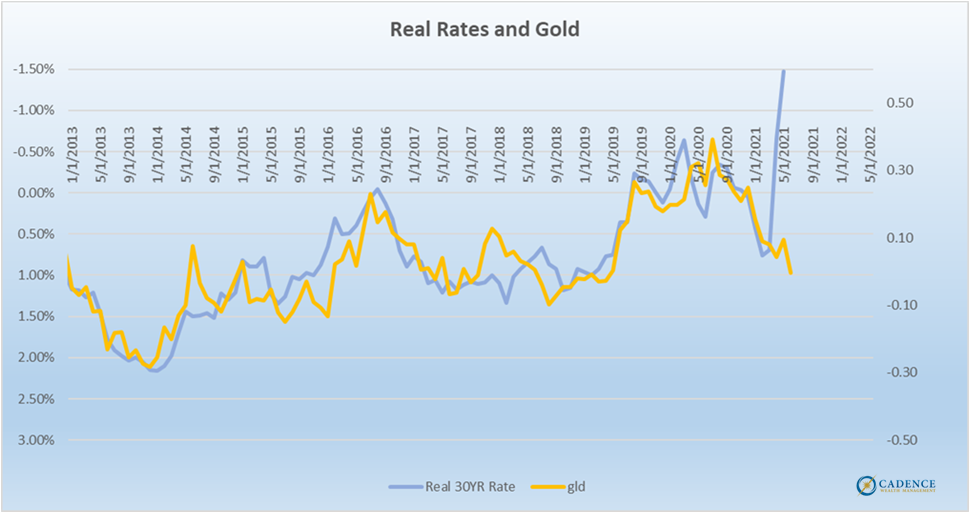
What we know from observing the last eight years is that the price of gold tracks the level of real interest rates (the 30-year Treasury bond rate minus the rate of inflation as measured by the Core Consumer Price Index) extremely closely. In the chart below, we inverted the level of real interest rates in order to see the correlation more clearly. The yellow line indicates the gold price, while the blue line indicates the level of real interest rates. What we can see right now is that while accelerating inflation has taken real rates deeply negative, the price of gold hasn’t matched that move directionally. To us, this either implies that the spike in inflation and/or the drop lower in nominal yields are temporary, and real yields will rise back into positive territory shortly, or gold prices have a very big move ahead in order to catch up. A compromise between the two could still leave quite a bit of room for the price of gold (and other precious metals) to increase over the coming months. If correlations between the two hold up going forward, a 30-50% increase in the gold price from current levels is possible.
All that said, the price of gold and other precious metals has been soft in recent weeks. There is no clear sign that money has been flowing into it from equities and other risk assets like we’ve seen in Treasury bonds. We’ll continue to monitor this to see if it changes, but from looking at the chart below, one thing is clear; given how far behind the move in real interest rates the gold price is, if and when the buying and money flows resume, it could happen very quickly and aggressively. Change happens.
Conclusion
Change takes many forms. Over the last 10 plus years, we’ve had lots of little changes within the giant uniform trend of asset prices rising. Things work for a while making lots of money, then suddenly stop working and lose money. We’ve had multiple sharp interruptions over the course of this bull market that got investors questioning things – 2011, 2015, 2018, and most recently early 2020. For most, these were inconveniences at best as the underlying belief throughout most of them was that the losses are temporary and prices will bounce back. Prices did bounce back, and each time they did served to further reinforce this thinking. Our investment philosophy seeks to anticipate and react to these small changes within larger trends, with the goal being to keep our clients from losing more than they have to, which in turn should help them make more in the long run.
The big changes are something different entirely. When a long-term trend ends, everything we’re used to gets turned around and thrown in reverse. The investments we’ve been conditioned to buy on dips and watch bounce back stop bouncing back. The asset classes that have been very difficult to own and never seemed to go up when they should suddenly start going up. Patience is rewarded and impulse is punished. Big change truly changes lives either for the better or worse. What we know from past “big change” moments like 1929, 1973-74, 2000, and 2007 is that investors who either don’t see them coming or don’t prepare for them get served. What we also know is that because we’re all humans afflicted with recency bias and are susceptible to classical conditioning over time, most of us will either not see major changes coming or will fail to plan for them. As our clients well know, we are committed to doing everything we can to help them anticipate these moments and prepare for them.
So, are we on the cusp of big change? Maybe. We’re at a point now where the easy part of the current growth cycle is behind us; it gets tougher from here. So, we have to be on the lookout for clues as to whether markets will anticipate and to some degree facilitate that slowdown in the cycle. Stocks are sitting on a key level of momentum support, bonds look like they’re anticipating trouble, and gold looks like it’s ready to react to trouble at the drop of a hat. If financial markets start to price in a growth slowdown in unison, the big wildcard in determining what a proper asset allocation should look like at that point is inflation. If inflation continues to linger or even rises further, then commodities should hold up relatively well even with a weak stock market – 2007 into 2008 is a good example of this. Should inflation start to recede, then commodities would more likely suffer a similar fate to the stock indexes early on at least. Our thinking at the moment is that inflation will be more durable than growth in general over the coming months, which would reward exposure to commodities in one’s portfolio. We’ll keep an eye on the data and react accordingly.
It’s important to keep in mind that the growth and inflation cycles are shorter term in nature, running a few quarters at a time. They happen throughout both bull and bear markets. The big change we’re on the lookout for because of the extreme valuations we’ve talked about in stocks and just about every other aspect of life today, may get ushered in during the next growth cycle slowdown or it may not. If there’s one thing we’ve learned over the last few years it’s that central bank policies and government actions can delay the inevitable for much longer than we’d think possible. We are at record stock valuations, real estate prices, and debt levels because of actions taken to prevent all those things from reverting back to more “normal”, and we’d argue “healthy” levels. There’s nothing saying that they won’t succeed in arresting the next economic slide or stock market decline when it arrives – temporarily. However, strong-arming asset prices to new highs the next time around would not represent big change. Big change would be them failing to do so, and it always arrives eventually. We’re on the lookout for it and will manage risk appropriately whether it’s just around the corner or a few more years away.
Editor’s Note: This article was originally published in the July 2021 edition of our “Cadence Clips” newsletter.
Important Disclosures
This blog is provided for informational purposes and is not to be considered investment advice or a solicitation to buy or sell securities. Cadence Wealth Management, LLC, a registered investment advisor, may only provide advice after entering into an advisory agreement and obtaining all relevant information from a client. The investment strategies mentioned here may not be suitable for everyone. Each investor needs to review an investment strategy for his or her own particular situation before making any investment decision.
Past performance is not indicative of future results. It is not possible to invest directly in an index. Index performance does not reflect charges and expenses and is not based on actual advisory client assets. Index performance does include the reinvestment of dividends and other distributions
The views expressed in the referenced materials are subject to change based on market and other conditions. These documents may contain certain statements that may be deemed forward‐looking statements. Please note that any such statements are not guarantees of any future performance and actual results or developments may differ materially from those projected. Any projections, market outlooks, or estimates are based upon certain assumptions and should not be construed as indicative of actual events that will occur. Data contained herein from third party providers is obtained from what are considered reliable sources. However, its accuracy, completeness or reliability cannot be guaranteed.
Examples provided are for illustrative purposes only and not intended to be reflective of results you can expect to achieve.

