Those watching the performance of risk assets like stocks and commodities since the beginning of the year can be forgiven if their heads are spinning. Most risk assets were up the first two months of the year, with the S&P barely so. March saw most risk assets sell off, except oil which continued its upward climb, only for stocks to rebound in April while precious metals continued seeing more sellers than buyers, and oil moved sideways. Up, up, sideways for oil; up, down, down for precious metals; and, up, down, up for stocks. Every month there’s a new winner and a new loser. It’s easy not to have a clear picture of what has actually been happening to asset values this year, both risk assets as well as the more conservative assets.
Through a couple days ago, the performance of major asset categories and some of the subcategories contained inside so far this calendar year were:
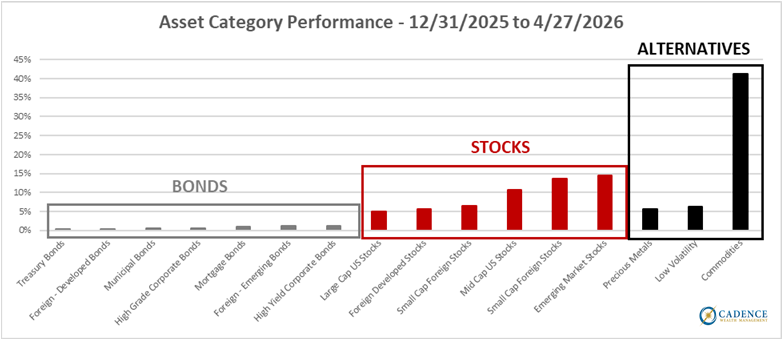
Bond indexes are having a very quiet year, averaging less than 1% growth so far, which annualizes to around 2.5%. Large cap stock indexes, both foreign and domestic, are certainly performing better, with their average increase so far in 2026 between 5 and 6%, which if that pace were to continue would come in around 18% on the year. Precious metal gains on the year are similar to large cap stocks’, also annualizing to around 18%. Commodity indexes with high oil allocations are the clear winners so far this year, up over 40% year-to-date which extrapolates out to an over 200% gain on the year. Again, were the current pace to continue. With all the turmoil, risk assets are still performing pretty well, but notice how the star performer is oil-heavy commodities. Incidentally, they were rising before any shots were fired.
Considering how these times of turmoil have not knocked stocks down far at all, and how it is a tangible asset like oil that is the clear winner, it may be no surprise that since volatility picked up noticeably at the end of 2018, stocks have also done well over that time period, and that another tangible asset class, precious metals, has outperformed everything by a wide margin:
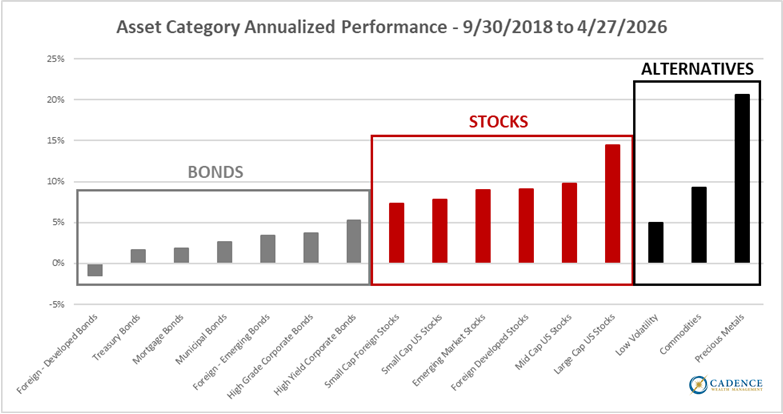
Since the end of September 2018, bonds have underperformed, stocks have hit their long-term averages, more or less, with large cap US stocks delivering superior returns in that group, but precious metals have averaged over 20% per year for nearly 8 years. What explains that?
Risk assets move through cycles where stocks outperform metals for a while, and then it flips to metals outperforming stocks. Even within stocks, domestic indexes beat foreign indexes for a period of years, and then it switches to foreign outperforming domestic. The chart below shows the periods where the S&P 500 outperformed gold and silver, and also the periods where metals outperformed stocks, going all the way back to the 1960’s:

The light blue shaded areas are when metals were beating stocks, and the red shaded areas are the reverse, where stocks were beating metals. It’s hard to see on this particular chart, but the inclusion of some trend lines in the chart below makes it more apparent:

With the inclusion of the trendlines, it’s easier to see when one asset is going up, the other asset is going sideways or down. So, from the late 60’s to the very early 80’s, it was precious metals that were doing well with the S&P 500 moving sideways. Then for almost 20 years, stocks were on a tear and precious metals were giving back some of their previous gains. From the top of the tech bubble through the great recession recovery, it was metals producing massive gains, only for large cap US stocks to continue on after the great recession recovery, averaging over 13% per year between 2012 and today. Which brings us to the upper right of the chart, where I have circled in red. The trend lines in that circle show the longest period where both metals and the S&P 500 were all increasing dramatically at the same time. This period is the same one illustrated in the second bar chart, where the S&P is up over 14% per year, well above its long-term average, while gold and silver are up around 20% per year. Are we still in the period where stocks outperform metals, or did that flip somewhere after September 2018? We will only answer that question years from now when we have the benefit of hindsight, because with both stocks and metals increasing so aggressively, there is no way to tell. The good news there, for people who invest in long-term precious metal cycles is, it doesn’t matter. In all periods where metals were performing better than stocks, there were two major stock bear markets. Gold and silver have returned 20% per year since the third quarter of 2018 without even one stock market crash, much less two. This could either mean we have entered a period where metals outperform and a stock market crash is coming, or we have not yet entered that period but metals have been performing extremely well regardless.
Where do precious metals and stocks go from here? At some point, one of them will have to blink and the other will then be outperforming on a relative basis. Consider the ratio of the Gold/Silver Sector Index (XAU) price, a capitalization-weighted index composed of companies involved in the gold or silver mining industry that we will use as a proxy for precious metals prices, relative to the price of the S&P 500 index going back to the early 1980’s:
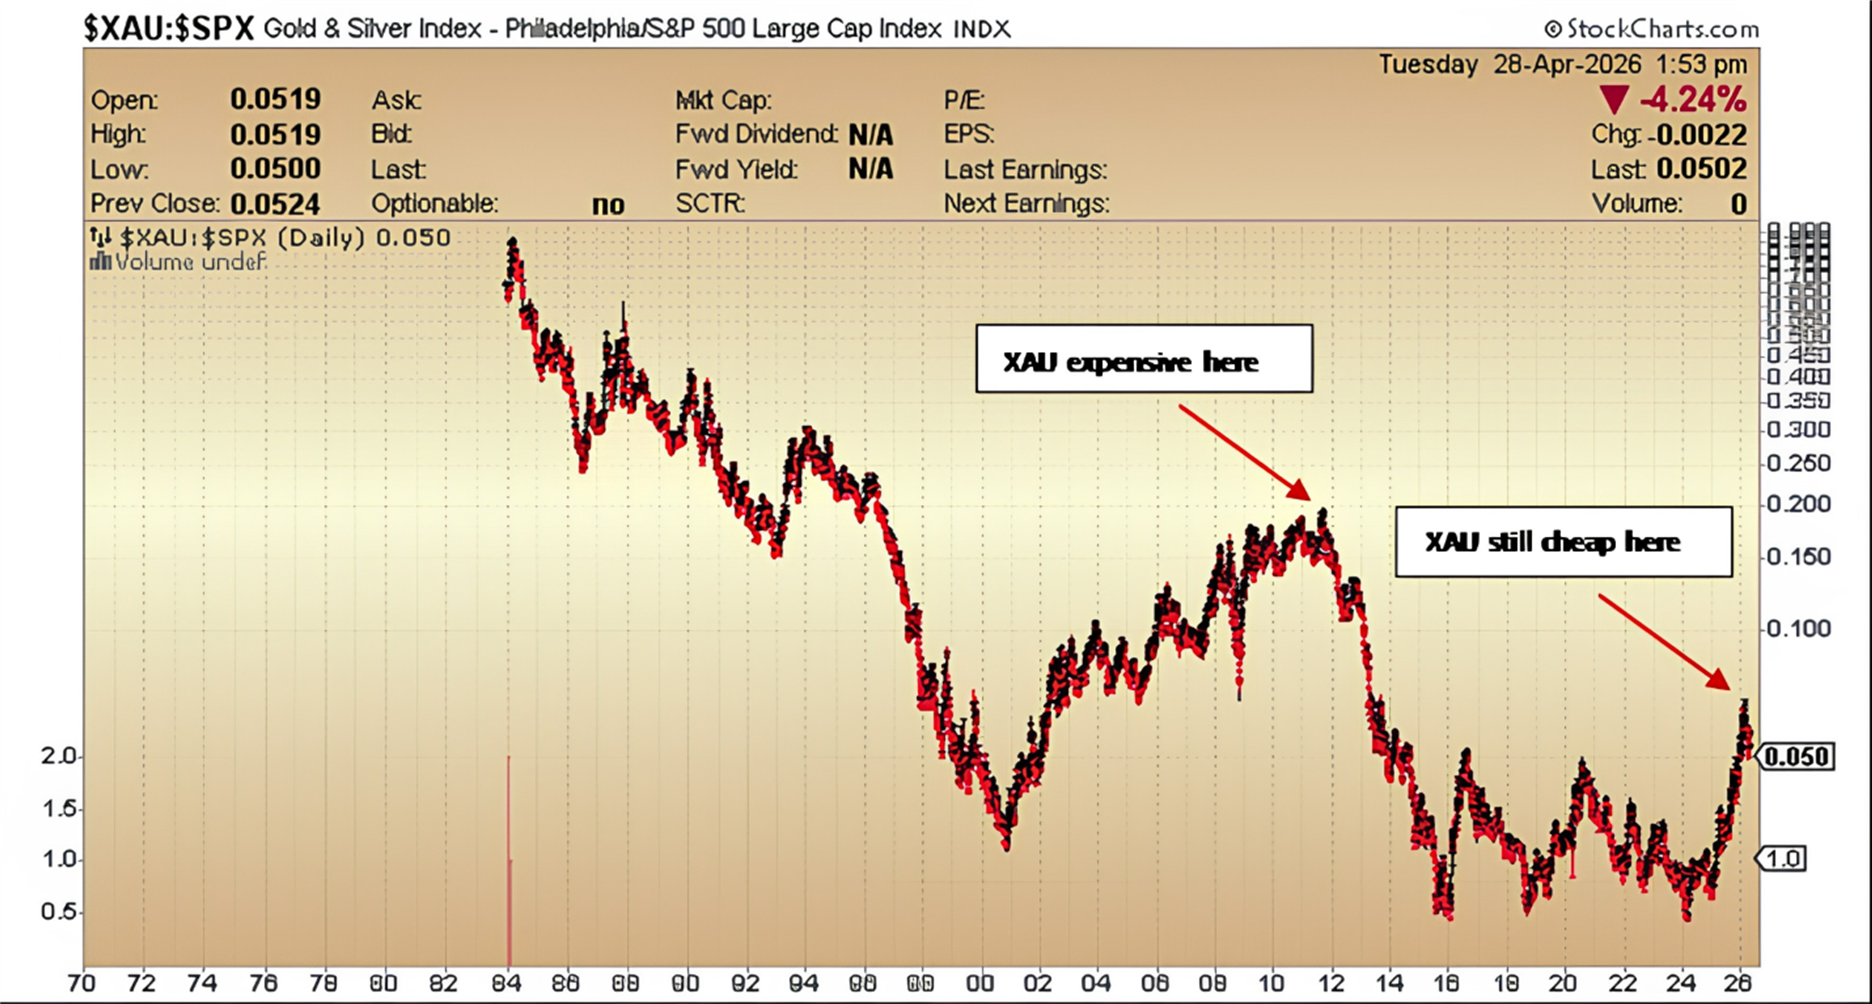
When the line is high, it means the stock prices of the precious metals miners were high relative to the S&P 500, and when the line is low it means the opposite: the S&P 500 is expensive relative to the miners. You can see the periods I alluded to in the previous chart. From the early 80’s to 2000, the S&P was on the rise and gold and silver were falling. Then, when the tech bubble burst, all the way though the Great Recession crash and recovery, precious metal miners’ stock prices were increasing relative to the S&P 500. You can also see that even with precious metals and mining stocks’ prices increasing dramatically since the end of 2024, mining stock prices are still relatively cheap compared to the S&P 500. What this suggests is that precious metals and mining stocks still have a ways to go in price moves relative to the S&P.
The price of brent crude oil relative to the S&P looks similar:

There’s been a lift-off as of late for oil prices relative to stock prices, but there’s even more room for oil to outperform stocks than there is for precious metals.
Long-term cycles happen. You can see for yourself how long these ups and downs last. If the old adage “buy low, sell high” is at all true, then investing in these cycles is best done when the relative price of one, either metals or oil, is cheap relative to stocks, which has been the case and remains the case. We may be 2 years into a 10-15 year cycle, or 8 years in, or maybe even 10 years in, but these cycles do not fizzle out until an extreme point is reached, and both metals and oil are well below extreme levels compared to the S&P.
There are many factors that affect the price of metals, oil, and stocks. Some factors help all three, some hurt all three, and some hurt some and help others. Long-term cycles develop when factors that help some much more than others are present for extended periods of time. One such factor that has started playing out to a degree that no one can measure yet is de-dollarization, which is seen to help metals and oil prices and hurt US stock prices.
What is de-dollarization?
De-dollarization refers to a meaningful decline in the use of the U.S. dollar in global trade and financial activity, reducing demand for it by governments, institutions, and businesses.
More specifically, it involves changes in the long-term, structural demand for the dollar tied to its role as the world’s primary reserve currency. This includes its dominance in foreign exchange trading, commodities pricing, debt denomination, and central bank reserves.
This structural shift is different from short-term fluctuations in demand, which are often influenced by factors like strong U.S. economic performance or stock market gains. While recent years have seen high demand for the dollar due to U.S. economic strength, that demand could ease if that advantage fades.
What drives de-dollarization and what does it mean?
Two main forces could weaken the dollar’s global position.
The first is negative developments within the United States that reduce confidence in the dollar’s stability. Political division, weaker governance, or policies such as tariffs could make U.S. assets seem less reliable and less attractive to global investors. There are obvious signs of these today.
The second is positive progress in other countries that strengthens alternative currencies. For example, economic or political improvements in China could increase trust in the Chinese yuan or other currencies as viable substitutes. For any currency to rival the dollar, it must be stable, widely trusted, and able to support large-scale global demand. For the time being, there is no obvious foreign currency successor to the U.S. dollar.
If de-dollarization accelerates, it could shift global economic power and reshape financial markets. The United States would likely be most affected, potentially experiencing a weaker dollar and lower performance in its financial assets. U.S. stocks could suffer from reduced foreign investment, while bond markets might face higher yields as global investors diversify away from U.S. assets.
Global trade trends
Although the U.S. share of global output and exports has declined over time and China’s has grown, the dollar still dominates international transactions. It remains the primary currency in foreign exchange trading, trade invoicing, cross-border borrowing, and global debt issuance. This has slowed the de-dollarization process.
Foreign exchange reserves
Signs of de-dollarization are visible, however, in central bank reserves, where the dollar’s share has declined to just under 60%. Another, more notable trend is the increasing role of gold, particularly among emerging market central banks such as China, Russia, and Türkiye. These countries are boosting gold holdings as an alternative to traditional currencies.
Although gold still makes up a relatively small portion of reserves, its share has grown significantly over the past decade, contributing to rising gold prices. By some estimates, de-dollarization alone could double the price of gold all by itself, regardless of other factors that increase demand. Oil prices would also rise as the value of the dollar falls, probably accelerating any price increases due to reduced supply as we have seen a bit of so far, with predictions of worse to come over at least the next year.
So, though this year has seen risk asset prices bouncing around, with most of them annualizing out at least 20% growth in 2026, the longer-term cycles suggest much more room for metals and oil-related investments to rise over the coming years as opposed to U.S. stocks. Increased demand caused by central banks preferring gold to dollars, and decreased supply caused by petroleum extraction and refining capabilities in the Middle East being reduced for the foreseeable future, give strength to the notion that whether we started the most recent commodity cycle outperformance eight years ago or two years ago, there is more time for it to run.
Editor’s Note: This article was originally published in the May 2026 edition of our Cadence Clips newsletter.
Important Disclosures
This blog is provided for informational purposes and is not to be considered investment advice or a solicitation to buy or sell securities. Cadence Wealth Management, LLC, a registered investment advisor, may only provide advice after entering into an advisory agreement and obtaining all relevant information from a client. The investment strategies mentioned here may not be suitable for everyone. Each investor needs to review an investment strategy for his or her own particular situation before making any investment decision.
Past performance is not indicative of future results. It is not possible to invest directly in an index. Index performance does not reflect charges and expenses and is not based on actual advisory client assets. Index performance does include the reinvestment of dividends and other distributions
The views expressed in the referenced materials are subject to change based on market and other conditions. These documents may contain certain statements that may be deemed forward‐looking statements. Please note that any such statements are not guarantees of any future performance and actual results or developments may differ materially from those projected. Any projections, market outlooks, or estimates are based upon certain assumptions and should not be construed as indicative of actual events that will occur. Data contained herein from third party providers is obtained from what are considered reliable sources. However, its accuracy, completeness or reliability cannot be guaranteed.
Examples provided are for illustrative purposes only and not intended to be reflective of results you can expect to achieve.

