As a follow-up to an article in our last monthly newsletter, “Zombie Bull Disease”, we mentioned that the next few weeks would be important in learning whether or not the Federal Reserve’s “all in” monetary policy intervention would be enough to save the economy and markets from the downward part of the cycle. What we’ve learned in the three weeks since writing the piece is that although stock markets have marched higher in true zombie fashion, completely unfazed by any news that would typically cause at least temporary volatility in prices, things are not normal by any stretch. We continue to see a confluence of economic and market signals that suggest that stocks are completely disconnected from reality, which despite the steady and sleepy rise in prices that helps investors feel comfortable putting their hard-earned savings to work, actually serves to increase the risk of sudden, dramatic loss.
The latest piece of economic data released last Friday, industrial production, did not show any evidence of the Fed’s intervention making its way into the manufacturing portion of the economy. On a year-over-year basis, we’ve gone from slowing from the cycle peak last year to actually contracting by -1.1% as of the end of October. Further evidence that money-printing ends up mainly in the financial markets rather than the actual economy (side note…this is precisely why Fed policy has contributed to wealth inequality rather than reduced it. Those large players with the most money in and access to financial markets simply benefit the most).
![]()
Meanwhile, the cost of funding for lower-grade corporations continues to rise. As of yesterday, the junk to BBB spread sits at 9.49%, a three year high. Over the past 15 years, this spread has been consistent with large stock market declines. In fact, we haven’t seen this level without a decline of at least -14% either immediately preceding or subsequent to it.
![]()
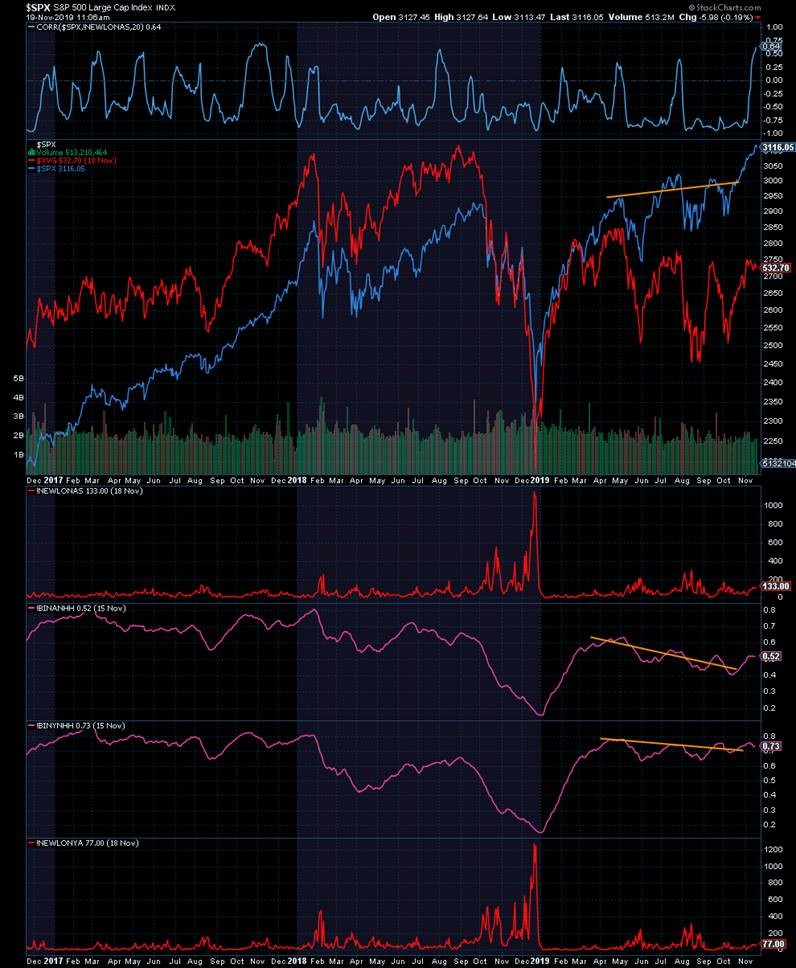
And looking within the stock market itself, the broad equally-weighted stock market per the Value Line Geometric Index is far from all-time highs and trending lower (red line on chart below). In addition, the number of stocks making new price lows on the Nasdaq is rising at the same time the Nasdaq index is rising, indicating the same type of internal divergence we’ve highlighted with the Hindenburg concept (top blue line on chart below measures correlation between new lows and index movement). Notice how positive correlation between the two – both moving up together – has been typical of market tops.
All of this indicates that although market indexes are rising, it’s not for any good fundamental reason. The story is completely about Central Bank liquidity injections which fuel stock buybacks and large scale institutional ETF purchases (which likely explains why the biggest companies’ stocks are dramatically outperforming smaller ones with lower weightings in popular ETFs). Piling freshly minted money on top of an inherently unstable debt-laden system where asset prices are already grossly inflated probably isn’t the best way to generate returns for investors that will last. And if they don’t last, then they won’t help. The risk/reward really doesn’t get much worse for assets that depend on continued Central Bank support in order to avoid a long-overdue repricing. If these market signals reverse course and start telling a more promising story, leading to a better risk/reward setup, then we’ll adjust accordingly. Until that happens, we remain skeptical that the Fed has things under control. Defense, defense, defense.
Editors Note: This post is a follow-up to an article, “Zombie Bull Disease”, originally published in the November 2019 edition of our “Cadence Clips” newsletter.

