It’s not easy for a diversified investor to know what their investments should be returning over most time frames. Just because the S&P 500 is up 15% this year, should you be too? The S&P 500 plus dividends was up 40% over the past twelve months, but since you have a diversified portfolio, what is a normal return for you over the same period? For any short-term period, like a year, how do we know if we’re still on track, or if our returns show something has gone wrong?
Given the amount of media coverage large cap US stocks receive with ubiquitous reporting on the Dow and S&P 500 throughout the day right up to the nightly news, most diversified investors resort to comparing their own returns to one or both of those indexes, despite their portfolios possibly containing only 20% or less in large cap US stocks. That is kind of like wondering why your mixed breed dog with 20% greyhound ancestry can’t keep up with an actual greyhound at times. Sure, your dog can’t run as fast, but it’s still pretty quick and it also avoids the negative greyhound characteristics you wanted to avoid which is why you got a mixed breed dog instead of a greyhound in the first place.
Hearing how just one asset class is doing makes it very difficult to know what your diversified portfolio should be doing. One place that may have performance information for more than just large cap US stocks is your 401(k) or 403(b) plan. You can usually find performance information for all the funds available for the plan either on a statement or via an employer-provided website, but having that kind of information at hand can cause another type of problem: “Return Envy”. You see the returns for the aggressive investments during the good times and they can look extremely tempting. Even though you probably do already have exposure to some of those high-octane funds it is very easy to think if you just had more of them then you’ll really be off to the races. Millions of Americans see those high returns during bull markets and start shifting their allocations to be more and more aggressive, and it works until the next bear market comes and then it suddenly doesn’t.
With either incomplete information or a lot of different pieces of information with no real explanation on how to actually use them, how are you to know if what your investments are returning is what they SHOULD be returning?
WHAT ARE “NORMAL” DIVERSIFIED INVESTMENT RETURNS?
You get a pass right now if you’ve never taken a statistics course, but if you who have, it’s time to dust off some of those things you swore you’d never, ever use in real life, or possibly hoped you wouldn’t have to. One of the reasons clients work with Cadence advisors is we have the knowledge required to verify if a mix of many different investments is behaving as we would expect it to over time. We wear many hats as advisors, and one of our roles involves educating our clients so they have a comfortable understanding of financial planning and investing concepts. Sometimes the knowledge we are passing is easy, and sometimes it’s, well, challenging. Learning how to calculate if your investments are performing as intended may be more the latter than the former, because it all comes down to those darn statistics.
There is a way to measure whether or not your investment returns are “normal”, and this is by using the concepts of “mean” and “standard deviation” in conjunction with each other. “Mean” is pretty much a fancy way of saying “average”, whereas “standard deviation” is a fancy way of expressing how volatile an investment is. The two of them work in conjunction because the standard deviation tells you just how high or low returns are likely to go, and the mean is what all those different returns average out to over time. Think of it this way: the day to day, month to month, and year to year returns for your investments are a product of their standard deviations, and the long-term average from all those different returns is the mean. We set a target return (mean) and then we manage the volatility over time (standard deviation).
The higher the standard deviation for an investment or for an entire portfolio, the more it will fluctuate up and down over time above and below its mean. Even though you may expect to earn a certain return from your investments, the vast majority of the time you will earn something else, either more or less, and that is completely normal. Keep in mind, you will have below average returns 50% of the time by definition.
An example of how the shorter-term returns can differ profoundly from a long-term average is when you ask someone how much they expect the stock market, specifically the S&P 500, to earn over time and they tell you the common answer of “8 to 10%”. That’s actually pretty accurate for the long-term return, but the yearly returns can deviate from that, and they frequently do by quite a bit. The average annual return of the S&P 500 plus dividends between 1928 and 2020 according to data provided by the Stearn School of Business is 9.8%, but look at just how many times the annual returns on the road to get that 9.8% fell between 8-10%:
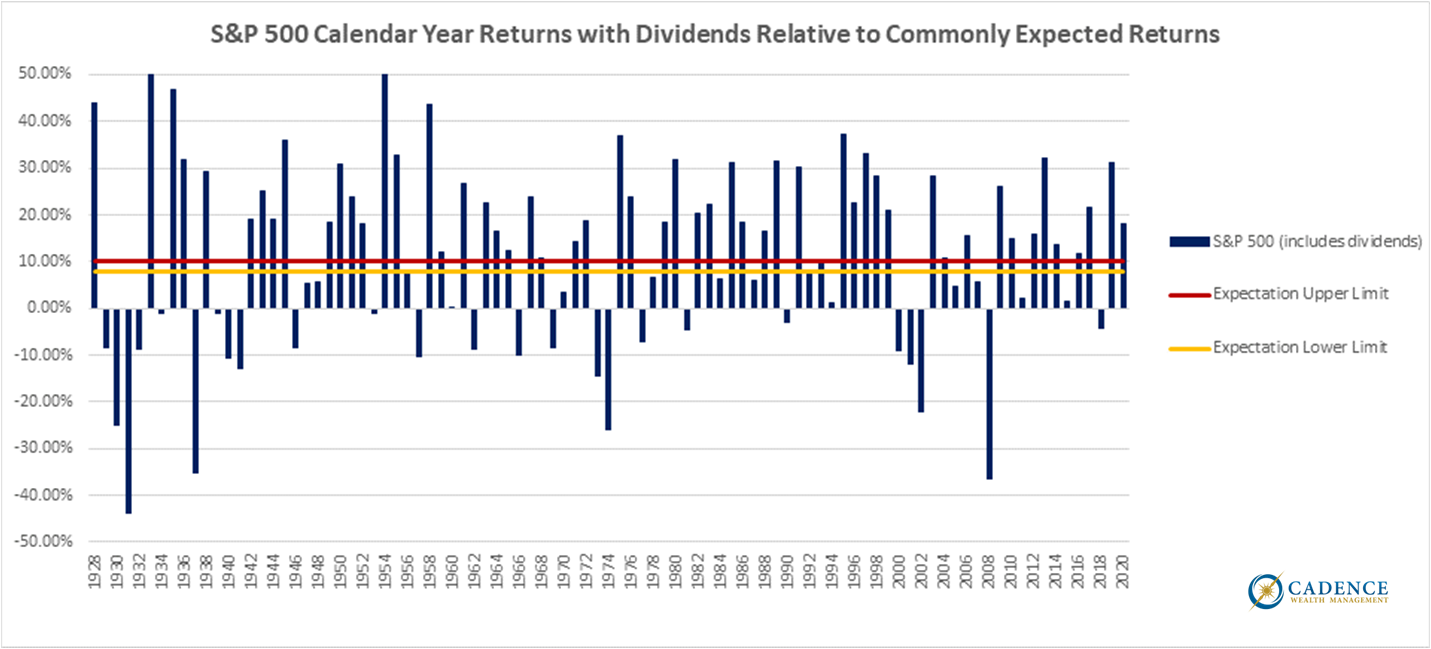
The blue lines show the calendar year returns and the red and yellow lines create the 8-10% range. It’s hard to see here because there are 93 different blue lines crammed into a small space, but care to guess just how many times the S&P 500’s calendar year total return actually fell between 8 and 10%? ONCE. Yes, just once in 1993 when it was 9.97%. And if it had only earned 0.04% more that year it would have been zero times in 93 years! The index has earned 9.8% per calendar year starting in 1928, and it only actually returned what many people would expect it to 1.1% of the time. The takeaway on this one is that you’re very, very rarely going to earn what you think you should in the short term on your way to your long-term return.
So, what is “normal” then?
The math behind this is pretty simple provided you have the right information. You take the mean of the investment, or the investment portfolio, and you add and subtract one standard deviation. That gives you a range above and below the mean. Approximately 68% of the periodic returns should fall inside that range. Adding and subtracting one more standard deviation on each side gives you a range within which approximately 95% of all periodic returns should fall. This does mean that it would still be considered normal for a small number of returns to fall outside that wide range. So even when the portfolio has an unbelievably good year or a disappointingly poor one, it is actually to be expected and would be considered normal. Just look back at the last chart to see how common it is for the S&P 500’s return to be well above or well below 9.8% for a calendar year.
For a 50% stock, 50% bond portfolio with a current 20 year mean of 6.2% and standard deviation of 11.4%, doing that math looks like this:
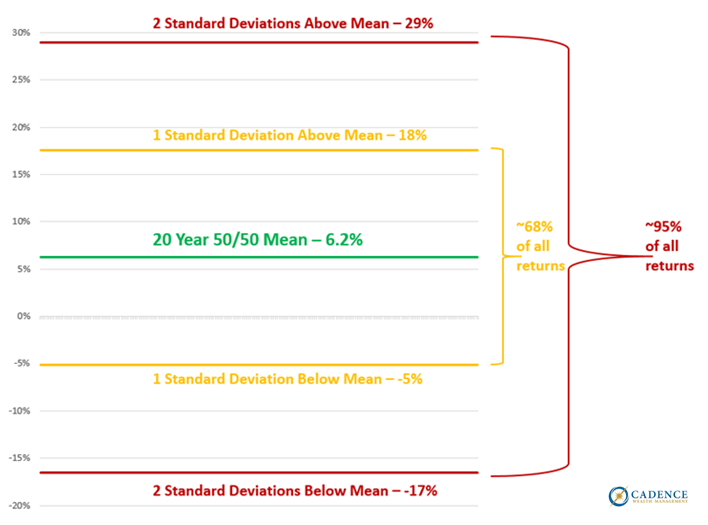
This is the statistical model for all 247 twelve-month periods between December 31, 2000 and June 30, 2021. The majority of the time, this portfolio should have returns between 18% and -5%, which still leaves 30% of all twelve-month returns to be better than 18% or worse than -5%. Consider that: just about one third of the time, this portfolio’s returns are going to look way better or way worse than 6.2%, and that is normal.
Let’s just go ahead and satisfy our curiosity on this one. Just how WOULD this 50/50 portfolio’s returns have done relative to these statistics?
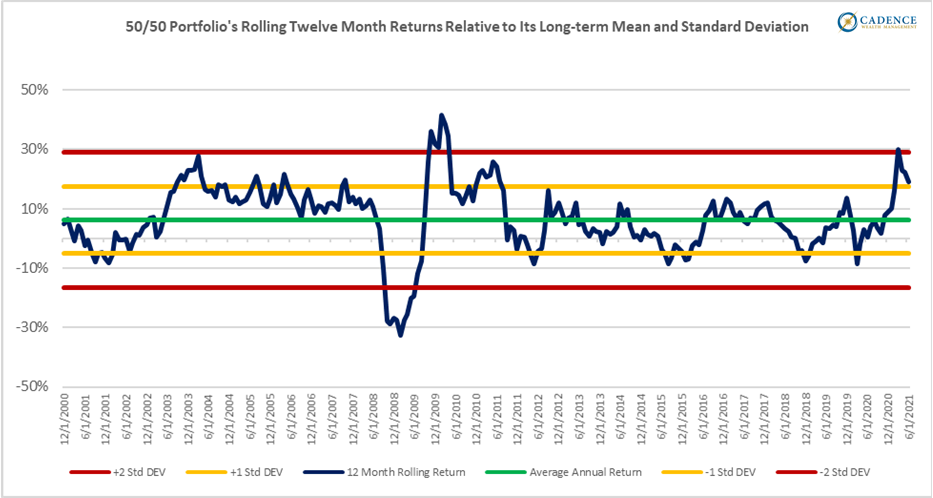
Now that you have completed, or revisited, statistics 101, you can see this distribution appears to be behaving mostly as expected. The majority of the returns look to be between the yellow lines, and occasionally the blue line is between a yellow and a red line. It’s rare, but there are 16 twelve-month returns that are better or worse than two standard deviations above or below the mean. Most of them are during or right after the financial crash of 2007-2009.
Analyzing portfolio returns using mean and standard deviations does have its limitations. Those statistical measures are dependent on the time period being measured, and the shorter the time period measured, the greater the likelihood the data may deviate from the expected outcome. The 50/50 portfolio we used would have a different mean and standard deviation if we used thirty years, or ten years, or a different twenty years than we did. The twenty plus years we used were good periods to measure, considering both the tech bubble as well as the financial crisis of 2007-2009 were included in that measurement period, which gives a very good indication of just how bad or good returns can get. Despite that, the 2.5% chance that a portfolio’s return gets worse than two standard deviations below the mean is guaranteed to happen from time to time. Though there are times where the outcomes deviate from the model, especially during extreme events like two standard deviation plus market crashes that can happen more often than the model seems to suggest, it is still a good way to estimate when a diversified investment portfolio is behaving as expected to a meaningful degree.
What Does That Mean for 2021 So Far?
If you are wondering how this applies to your returns so far this year, it’s not all that accurate to compare half-year numbers to statistics generated from full-year returns. However, we can look at how the various asset classes have performed so far this year and compare our own diversified portfolio’s return to it and at the very least get a general sense for how we are doing. Looking at both the aforementioned 50/50 portfolio as well as a portfolio that has 30% of its assets in Cadence separately managed accounts and the remaining 70% split 50/50 like the first portfolio, it looks like they are performing as well as we’d expect at this point in the year when compared to a variety of asset classes:
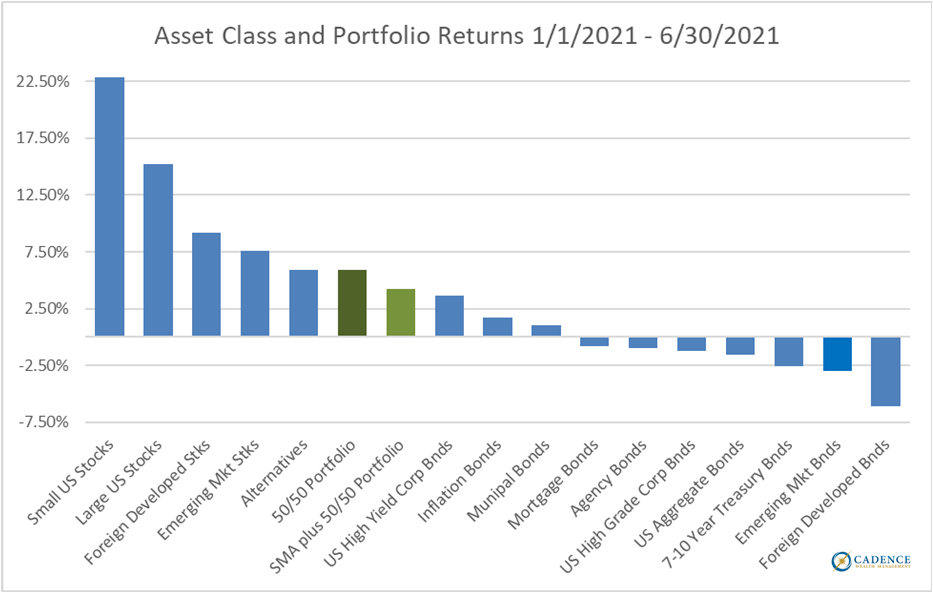
With small and large US stocks having a good year to this point, but with everything else returning quite a bit less, and in some cases being negative, the mid-year returns on the two diversified portfolios appear not to be doing better or worse than we’d expect. They are being pulled up by their stock allocations, especially US stocks, but being held down by pretty much everything else. Looking at the twelve-month returns for both portfolios, they both fall within their normal ranges. The 50/50 portfolio is a bit higher than one standard deviation above its 20 year mean of 6.2% over the past twelve months, and the 50/50 portfolio that also has Cadence separately managed account exposure has returned just a shade under its 8.8% 20-year estimated return over the same timeframe.
We can use history as a guide to help us find that mix of assets that we think should get us that proverbial 6-8%, and now we know just how common it is for the periodic returns to differ up and down from that target. That is a reasonable way to view a diversified portfolio’s construction, but as we have reported many times, including already twice this year with our March newsletter piece entitled “Narratives Aside”, and just last month with the piece “Change Happens”, the price you pay for an asset determines what you will get in the short and long term. Both newsletter pieces discuss the relatively high price of US stocks right now, such that it is reasonable to expect little to no growth, and possibly even negative growth, from large cap US stocks over the next ten to twelve years. This is why you have a diversified portfolio in the first place: if US stocks do not perform well in the coming years, you should have other investments that perform better. Depending on how many US stocks you have in your portfolio, you may experience more returns that fall within the standard deviations below the mean over the coming years than over past time periods.
Party Tricks That Matter
We should have paid more attention in those statistics classes, but if there’s one thing all those people who have loaded up on the aggressive asset classes since the financial crash should familiarize themselves with is just how low two standard deviations below their portfolio’s average returns actually is. Statistically speaking, you can’t avoid a two or more standard deviation loss forever. Whether it’s one or two standard deviations above, or one or two standard deviations below, your monthly or yearly investment returns are going to differ quite a bit from their long-term averages very frequently. THAT, for lack of a better word, is NORMAL. So the next time you hear someone discuss disappointing investment returns, go ahead and ask them what the standard deviation is. To a Cadence financial advisor, that is considered being the life of the party.
Editor’s Note: This article was originally published in the August 2021 edition of our “Cadence Clips” newsletter.
Important Disclosures
This blog is provided for informational purposes and is not to be considered investment advice or a solicitation to buy or sell securities. Cadence Wealth Management, LLC, a registered investment advisor, may only provide advice after entering into an advisory agreement and obtaining all relevant information from a client. The investment strategies mentioned here may not be suitable for everyone. Each investor needs to review an investment strategy for his or her own particular situation before making any investment decision.
Past performance is not indicative of future results. It is not possible to invest directly in an index. Index performance does not reflect charges and expenses and is not based on actual advisory client assets. Index performance does include the reinvestment of dividends and other distributions
The views expressed in the referenced materials are subject to change based on market and other conditions. These documents may contain certain statements that may be deemed forward‐looking statements. Please note that any such statements are not guarantees of any future performance and actual results or developments may differ materially from those projected. Any projections, market outlooks, or estimates are based upon certain assumptions and should not be construed as indicative of actual events that will occur. Data contained herein from third party providers is obtained from what are considered reliable sources. However, its accuracy, completeness or reliability cannot be guaranteed.
Examples provided are for illustrative purposes only and not intended to be reflective of results you can expect to achieve.

