When we look back 100 years at the relationship between the size of the stock market and the underlying economic fundamentals either by way of gross domestic product (GDP) or the amount of “stuff” that corporations produce (Gross Value Added), there are two things we can learn. First, stocks tend to rise with economic output. Makes perfect sense. Corporations do well, people do well, the economy does well, stock prices go up. The second observation however, which is far more important to investor performance over time, is that stock prices tend to rise faster than economic output when times are good and fall faster than economic output when times are hard. In other words, valuations get stretched in good times and contract beyond reason in hard times. For long-term, more buy-and-hold portfolio strategies, this is probably the single most important investment concept to understand.
Today, despite recent market turmoil, stock market valuations are stretched. In February of this year, U.S. stocks were in record expensive territory per a host of measures and today we only stand a few percent below those dizzying heights. Based on the 100-plus year relationship between the size of the stock market (market cap) and the underlying economy, if prices were to revert back to average levels over the next ten years, the S&P 500 would be at $2,664. It’s at $2,878 as of this writing. With dividends, that would put the average annual return at just about 1%…per year. This assumes the economy continues to chug away at 4% nominal growth per year and dividends continue to pay out at 2% of today’s market value. It does not take into account the sharp economic contraction we’re facing at the moment that very well could pull down that 4% GDP growth rate over the next ten years.
And so, this 1% total return for the S&P 500 is a very average scenario in a world that is anything but average. We’ve been witnessing the risk of a better than expected outcome play out over the last few years based on historical norms. The market returns we’ve witnessed the last few years are not normal by any stretch. The fact that valuations are so rich makes this fact obvious. Investors need to be keenly aware of the equally probable risk of a reversion of valuations beyond the mean into below average territory. This would lead to returns below 1% over the coming 10 years.
This aside and more relevant to our clients right now is the question “How much do stocks have to fall before they start to look more appealing?” With simple math and a few reasonable assumptions, we can answer this question.
First, the assumptions:
- The economy will grow at an average of 4%. If we assume official inflation of 2-2.5%, this puts us right where real (inflation adjusted) GDP has been over the last 10 years. It’s worth noting that we view this as a rosy scenario. It’s what we’ve done over the last ten years of good times. What happens to this number with a recession or two thrown in? We’ll tell you: It goes lower. Between 1929 and 1933 the economy declined 46% in nominal terms. That certainly impacted stock valuations just as a meaningful retreat in GDP would affect them negatively today. Again, for now we’ll err toward an optimistic outcome and assume we average 4% over 10 years.
- We assume dividends will continue to be paid at the current rate of 2% of the S&P 500, or roughly $57 based on a value of $2,878. When the S&P 500 falls, that dividend yield goes up since the same $57 will be paid on a lower index value. Again, this could be viewed as a rosy assumption since it doesn’t reflect dividend cuts throughout the downward part of the business cycle.
- As we stated, we assume ten years from now markets end at average valuations. This does not take into account a retreat below average which we’d consider very likely given ample historical precedent. It also doesn’t take into account the timing of markets getting back to average. This could happen sooner or it could take longer. We use ten years simply because of the very sound long-term correlation between valuations and subsequent market returns. Although valuations have no bearing on where markets will be in 6 months or even 2 or 3 years, they do provide more visibility around where markets will likely be over 8-12-year time frames. Valuation cycles take time the same way any other cycle does.
- Finally, we are only using data going back to 1963 for simplicity. This data set is skewed toward better market returns which has the effect of raising the average valuation level a bit higher than it probably should be. The price-only return for the Dow Jones Industrial Average from 1900 to 1964 was 3.8% versus 6.1% from 1964 to present. Add dividends and we’re probably a bit closer since dividends were higher back then than today, but some skew probably still exists. The result again could be that average is really a bit further down than we’re illustrating here.
With all that, here’s where we end up:
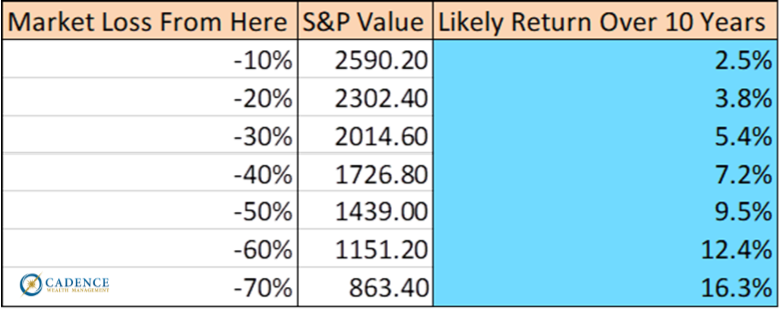
As we can see, if stocks (S&P 500) drop another 10% from here, then one could reasonably expect to earn a little more than they could from U.S. Government Bonds over the next 10 years – 2.5%. If they drop 40% from here, then we’re back up to a respectable 7.2% annualized total return. It’s not until we get over 50% lower than stocks are today that we get back to what we’d consider solid long-term returns of over 10%.
So when should one venture back into stocks? It really does come down to how much return it takes to compensate one for the short-term risk of investing in stocks. From a long-term buy and hold perspective, we’d probably start to pay attention after another 30% drop in prices. We’d probably get back to more “normal” portfolio allocations after a 40-50% decline, while we’d start to get genuinely excited about truly generational opportunities in the stock market (again, S&P 500) after anything more than a 60% drop. Valuations at that point would be far enough below average to provide a very reasonable margin of safety over the short term and very compelling reward over the longer term. Quite simply, the math would work.
As we already mentioned, volatile markets stir our emotions. They’re difficult. Making long-term financial decisions while staring at short-term fluctuations can be truly paralyzing. What makes it easier is having good data and a solid historical perspective. Knowing oneself is also crucial. Are we able to stay grounded in the data and math along the way or are we more susceptible to the shorter-term noise? Knowing this can help one to prepare and be more self-aware when times get tough. Understanding that what happens today with any particular investment has no bearing on where it’s likely to end up can be empowering. It helps us see through the noise of day to day movements and focus on the big picture.
There are attractive investment opportunities right now that we’ve spoken about. We are excited about those. When it comes to stocks on a market-wide basis, our excitement lies in knowing they will be attractive at some point down the line – possibly very attractive. We know the math which helps us immensely with waiting. It will not only keep us out of trouble, but help us to make smart decisions. When the time is right for our clients, we’ll be ready; to take a little action at first. Then, possibly a good amount more.
Editors Note: This article was originally published in the May 2020 edition of our “Cadence Clips” newsletter.
Important Disclosures
This blog is provided for informational purposes and is not to be considered investment advice or a solicitation to buy or sell securities. Cadence Wealth Management, LLC, a registered investment advisor, may only provide advice after entering into an advisory agreement and obtaining all relevant information from a client. The investment strategies mentioned here may not be suitable for everyone. Each investor needs to review an investment strategy for his or her own particular situation before making any investment decision.
Past performance is not indicative of future results. It is not possible to invest directly in an index. Index performance does not reflect charges and expenses and is not based on actual advisory client assets. Index performance does include the reinvestment of dividends and other distributions
The views expressed in the referenced materials are subject to change based on market and other conditions. These documents may contain certain statements that may be deemed forward‐looking statements. Please note that any such statements are not guarantees of any future performance and actual results or developments may differ materially from those projected. Any projections, market outlooks, or estimates are based upon certain assumptions and should not be construed as indicative of actual events that will occur. Data contained herein from third party providers is obtained from what are considered reliable sources. However, its accuracy, completeness or reliability cannot be guaranteed.
Examples provided are for illustrative purposes only and not intended to be reflective of results you can expect to achieve.

