Being disciplined is hard. When we think about our own private lives, if we’re being honest, none of us have any trouble coming up with instances where we broke down and diverged from our plan. Whether around dieting, exercise, or chores, discipline can wane – hopefully for only short periods of time when it does. When it comes to investing however, losing our discipline around what we buy and at what price can have much more dire consequences than missing a daily workout. Just last month we discussed how long-term returns can get cut in half by getting caught up in a 50%+ stock market decline. History is littered with examples of real people with real goals just like ours being permanently impacted by swooning markets when they arrive. The good news is by not confusing the health of a company or the broader market with the price of the corresponding stock shares, one can make a more informed decision as to what their investment might produce for them down the road.
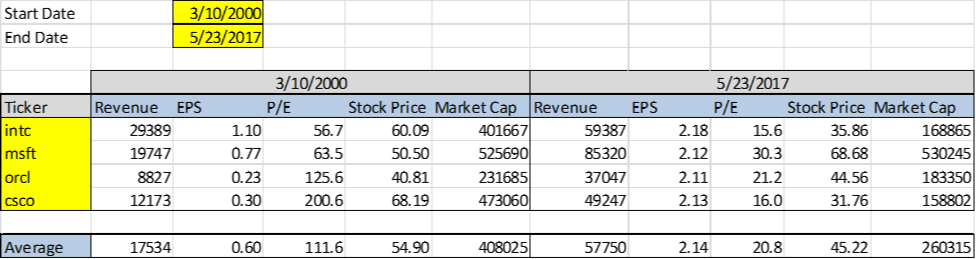
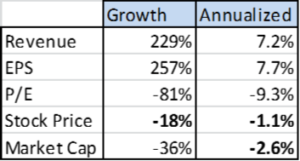
If someone asked you if you’ve heard of Cisco, Intel, Oracle, and Microsoft, there’s a pretty good chance you’d say yes to all. These four companies (we’ll call them the Fab Four for easy reference) combined have an average market capitalization – total value of all shares outstanding – of $189 billion dollars and have been tremendously successful over the last couple of decades. On average, they have grown revenue and earnings by over 3x since the turn of the century. They sell a lot of stuff, make a ton of money, and employ many thousands of people around the world. So, if you had to guess what a portfolio consisting of the Fab Four made since the beginning of 2000, you’d probably figure it produced something similar to the growth in revenue and earnings, right? Over 200% growth in these areas would break down to about 7% per year over the last 17 years.
Well, it’s not even close. Not including dividends, between March of 2000 and May of this year, the portfolio would be down -18%, or a little over -1% per year. With dividends, we’re probably just a smidge over breakeven – OVER 17 YEARS! How can this be? How can great companies that do large amounts of profitable business generate such lousy returns? The answer is, because there’s a difference between a great company and a great stock. It’s all about the price you pay for a company’s future earnings. Cisco, Intel, Oracle, and Microsoft held up their end of the bargain by delivering consistent growth over time. The problem is that in March of 2000, their share prices were so high that they needed to deliver much, much higher growth figures to justify the high price. On average, investors were paying 111x the earnings being generated by the foursome in comparison to the 16x or so that investors pay on average looking back throughout history. So even though earnings continued to grow, investors realized they simply wouldn’t receive adequate future cash flows from these companies to justify the high price of their stocks. And so over the last 17 years, the price to earnings multiple for the group began a long and painful journey from 111x back down to a little over 20x today. At some point, unless companies are able to deliver on exponential growth indefinitely into the future, multiples always come down, and when they do, so does the stock price.
Source: YCharts
This lesson can be applied today to both individual stocks and the market as a whole. We’ll discuss how some of today’s favorite stocks stack up in a bit, but first a few thoughts on the bigger picture. Like we’ve discussed at length in the past (most recently in last month’s “How Expensive Is the Stock Market?”), the market as a whole can also be richly priced relative to earnings. In the long run, markets are relatively rational, which is to say investors eventually come to realize that sound money decisions as well as the laws of finance actually matter. In the short run however, human beings deviate. In keeping with our opening analogy, it’s very similar to getting off track with health-related habits. After some period of time of eating poorly, not exercising, staying up too late, etc., we realize these habits are taking us down a dangerous path. With discipline, we pull ourselves back onto a more sustainable, sensible track. Markets are really no different. They can get off track for fairly long periods of time, but thus far over centuries of history, they have always found reason and sensibility eventually. Much like what happened to our Fab Four, valuations come back down over time across broad markets as well. This means that when they do, although companies within our economy may be plodding along just fine, their share prices would be in the process of adjusting lower. Good companies don’t necessarily mean good stocks, and by extension, a sound economy doesn’t mean an infallible stock market.
We’ll also point out that these adjustment periods don’t have to mean pain and misery within our economic system. Although it’s true that a falling stock market can impact the economy negatively, the longer-term correlations between the two are dubious at best. In much the same way a company can carry on and find success while its stock price is stagnant or falling, the same can be true about the broad market and the underlying economy. When markets come back down to Earth from extremely elevated valuation levels such as now, they don’t do so because of an economic slowdown or because profits suddenly start to decline. As much as Wall Street wants to focus on these things and identify a tangible reason for markets to decline (which very unsurprisingly, they never seem to find), there doesn’t need to be one. It simply comes down to valuation – and as soon as investors decide it’s time to bring sanity and reason back to their investment decisions, the process gets set in motion. It’s almost never a single tangible thing that catalyzes this change, but rather a series of seemingly insignificant things that together cause a shift in investor sentiment.
We can learn a lot from history. Whenever you hear a market pundit talking about how earnings are good and therefore stocks can go higher from here, remember the Fab Four. Earnings were great for 17 years, but it didn’t matter. It was all about price in 2000. Share prices can’t go to the moon. Eventually math takes over, regardless of what the economy does or whether or not corporate earnings continue to grow. At present the price to sales ratio of the S&P 500 has never been higher. In addition, as we discussed in our March letter “Is It Too Late To Jump In?”, on a profit margin adjusted basis, the cyclically adjusted P/E of the S&P 500 is virtually identical to where it was in March 2000 – record highs. Looking back through over a century of financial data, these levels are anything but rational. Markets have become exceptionally unhinged from the tangible reality underlying them. In 2000, we saw irrational behavior in both the broad market indices and the popular stocks of the day. The question is: Are we seeing the same manic behavior in the shares of today’s favorite companies?
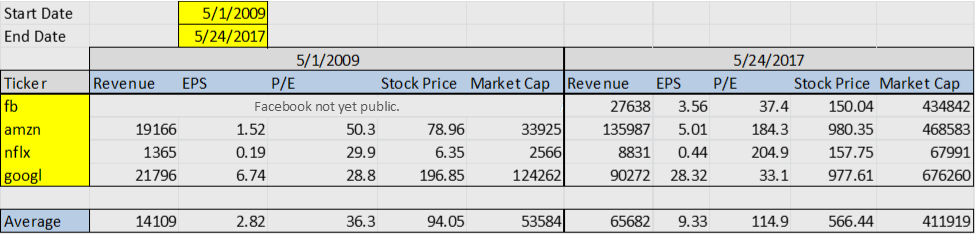
When looking at four of today’s most popular stocks – Facebook, Amazon, Netflix, and Google (let’s call this group FANG) – we find very eerie comparisons to the Fab Four. First, their average price relative to earnings is 115. That’s nearly identical to the 111 carried by the Fab Four. One could argue that Google is a much more established company and doesn’t have the same future growth potential as a younger company such as Tesla. Well, Google trading at 33 times earnings is actually bringing the average P/E multiple of the group down. If we throw Tesla into the group, the average P/E ratio goes up over 140. Since Tesla doesn’t even earn a profit, it essentially becomes an average of the remaining three companies. Technically if we assumed a penny of earnings per share for Tesla, the resulting multiple of 31,000 ($310 per share divided by $.01 earnings per share) would bring the average P/E for the bunch to nearly 8,000. Looking at price to earnings multiples isn’t always clean and certainly has its arithmetic shortcomings, but the point of the exercise is to get some idea as to whether something’s reasonably priced relative to profitability. Common sense should always be applied when special, more one-off situations lead to funny numbers, but this is not one of those times. Multiples are off the charts today when looking not only at the most popular stocks, but also the market-wide averages.
Source: YCharts
Second, the market capitalization of the FANG stocks is almost identical to our Fab Four. The FANG bunch stands at an average market cap of $411 billion whereas the Fab Four peaked at $408 billion. The law of large numbers states that when something gets too big, its growth will inevitably slow. Bigness means fewer potential customers for your products, larger overhead costs which ultimately weigh more heavily on profits, etc. Growing exponentially can only last for so long. In March of 2000, investors seemingly decided the Fab Four were too close to the Law of Large Numbers to justify their stock prices – the rest is history. We’ll see when investors start feeling the same way about today’s FANG group. Suffice it to say, they’re large numbers.
We’re seeing very similar excess today as we saw in 2000 in both the broad market and its most popular stocks. In the end, and right under our noses, the laws of finance and sound money took care of those high fliers from the year 2000. You can be sure that at some point in the future, those same age-old laws will adjust the prices of today’s overvalued stocks and by extension, the broader market. Most companies will carry on growing bigger and better, but that doesn’t necessarily mean their stocks will do the same thing. In the end, a stock’s price will reflect the underlying fundamentals and growth prospects of a company. So whether looking at a specific company or the market as a whole, if investors are currently overestimating or even ignoring those fundamentals and growth prospects, it may be a painful journey back to reality.

