What we’re experiencing in the financial markets right now is unique while at the same time very similar to previous bull markets. Those contending that this time is different are correct. We’ve never had synchronized global monetary easing on the scale we’ve witnessed over the last few years. This is new, and without question one of the primary drivers of this epic bull market run. The liquidity created by central banks around the world has created the desired effect – inflation. The only problem is that it hasn’t translated into price inflation to the extent desired (by central bankers) which gets consumers and corporations investing. Instead, it’s driven asset prices such as stocks and bonds to highs never before witnessed. The magnitude of this intervention is absolutely different from anything we’ve seen in the past.
Yet behind these new liquidity driven factors, we have the same old trusty market forces that we’ve always had; the classic bubble scenario that markets have gone through for literally hundreds of years. The specifics of each bubble are uniquely different, but the basics are the same. Something creates rising prices. Eventually those prices rise enough to bring in the doubters and skeptics. Price increases accelerate. People witness the changing fortunes of others and one by one, jump in themselves. A state of euphoria is reached and people actually start to believe that risk is minimal and that prices can’t go down – mainly because they haven’t. Eventually something tips the scale in the other direction, people realize they can actually lose money, and we’re left with way too many people running toward a crowded exit at the same time. This is the evolution of a bubble market regardless of what was responsible for creating it. So true as it may be that the powerful central banks have driven asset prices higher, the fact remains that we’re in a bubble. From here, regardless of how powerful the factors creating it may be, bubble dynamics will take over as they always have.
The Growth and Valuation Disconnect
When you look at investing in the most basic way, it always comes down to risk versus return. Generally over a long period of time, if you’re willing to take more risk, then you’ll have the potential for a higher return. That’s the whole idea of risk after all. If it works out, then a lot of money will be made. If it doesn’t, well, money will be lost. When things are going well, investors tend to forget that fundamentals, just like everything else in life, are cyclical. There is always risk of loss.
So if a company is doing well and growing its sales and earnings, investors feel more comfortable paying more money for each unit of those sales and earnings. In the investing world we refer to this as a “multiple”. Higher growth generally affords higher multiples. On the other hand, when a company’s fundamentals (business results) are moving in the wrong direction, investors usually aren’t willing to pay as much for each unit of production. For example, if a company is growing sales at 20% each year, an investor may be willing to pay 4 times sales (on a per share basis), whereas for a company growing sales at 5% each year that same investor may only be willing to pay 1 times sales. In theory, the company growing sales at 20% will eventually return enough cash flow to the investor to be equal to, if not better than, the cheaper more stable 5% growth investment. The important concept here is that the multiple or valuation should always reflect the growth prospects of the underlying investment.
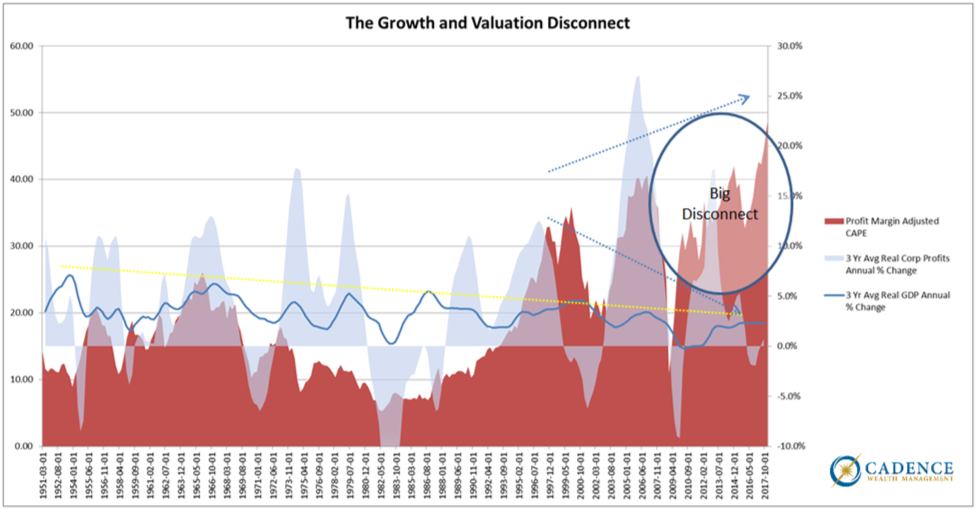
What we’re seeing now across the U.S. stock market is the exact opposite. Investors are paying more than they ever have for stocks in terms of multiples and valuation even though sales and growth figures are well below their historical highs. The chart below shows the symbiotic relationship between fundamentals and valuation right up until the last few years. You’ll notice that the valuation metric Profit Margin-adjusted CAPE (this is a price to earnings ratio that smooths out the business cycle over 10 years) ebbs and flows very tightly with both economic growth (GDP represented by the dark blue line) and corporate profits growth (the light blue area on the graph). There is a short period of time in the late 90’s where profit growth drops as valuations continue to march higher, but economic growth continues to trend higher along with it. One could have taken this disconnect between corporate profits and valuation as a warning that the tech bubble was entering its final stage.
What we’re witnessing now is a similar mismatch only larger. Both corporate profit growth and economic growth are lower than they were in the late 90’s while valuations are even higher. This is truly a gigantic disconnect between valuation and fundamentals. It’s worth saying again…both economic growth and corporate earnings growth are well below their longer-term averages yet investors are paying a higher multiple than at any point in history for stocks. If you come across anyone trying to tell you this is normal, safe, or not a bubble, then turn the channel, stop reading, or walk away. The facts suggest otherwise.
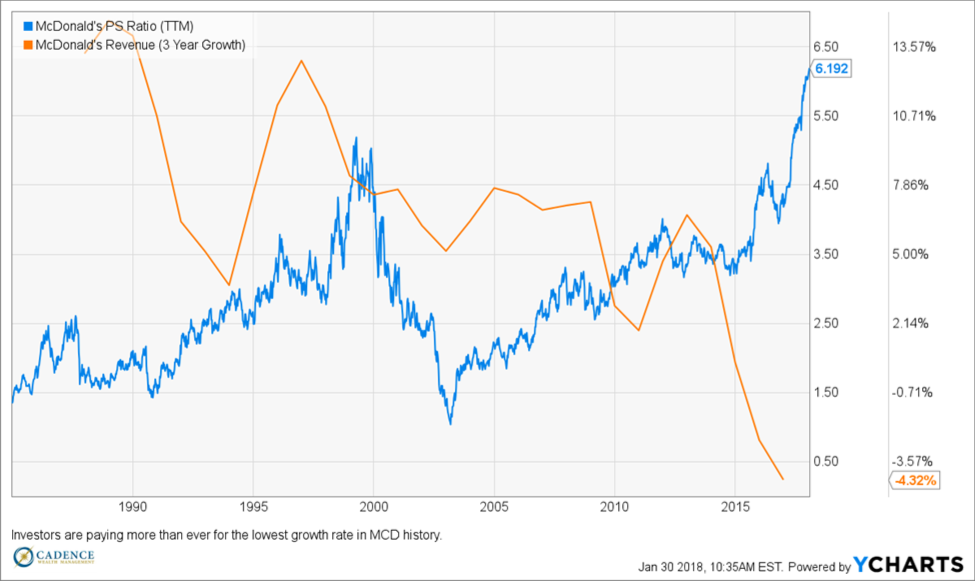
When we look at individual stocks, it gets even nuttier. There’s been a lot of talk about the FANG stocks (Facebook, Amazon, Netflix, and Google) and how their valuations resemble those of the big technology names from the late 90’s. We’ve even written about them in the past. However, today’s market bubble goes well beyond technology stocks. Investors search for yield and the vast amounts of liquidity making its way into U.S. markets over the years have driven share prices beyond their fundamentals across the board. Take McDonald’s for instance. Its three-year revenue growth rate is -4%, the lowest over the lasts 30 years, yet its price-to-sales multiple is over 6, the highest over that same period. The long standing relationship of valuations shadowing growth has been flipped completely. More important to investors, if the price-to-sales multiple came back down to more average levels of say 2.5x, then the stock would lose 60% of its value assuming sales held steady. Anywhere close to its prior cycle lows of 1.5x, and investors would see 76% of their position wiped out. This divergence between price and corporate fundamentals is gigantic.
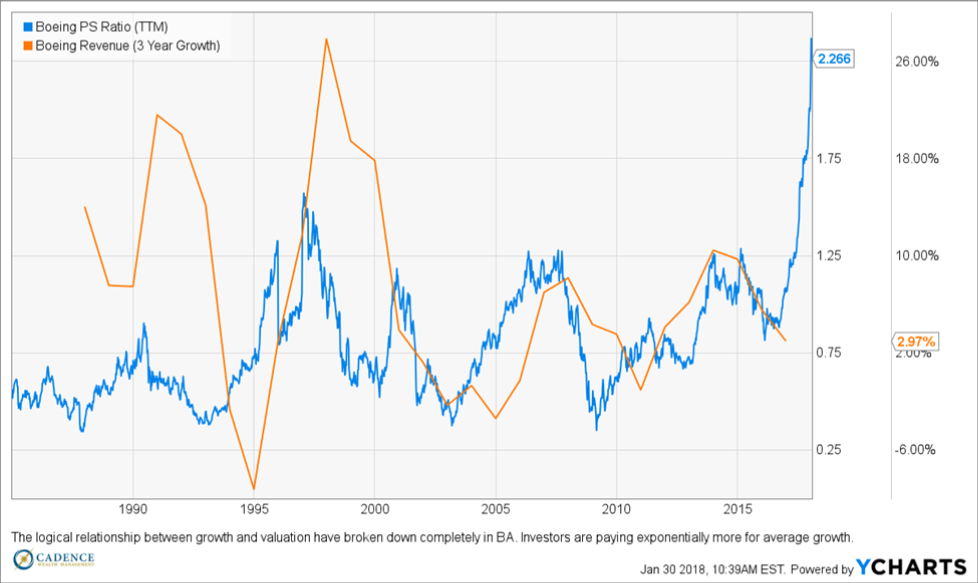
How about Boeing, the longstanding aerospace manufacturer who along with AirBus, provides the world with commercial aircraft among other things? Not what most would consider a very high-tech company and certainly one whose fortunes fluctuate with the broader economy. In short, its revenues and profits have been and should continue to be fairly predictable and boring.
When we look at the relationship between Boeing’s historical sales growth rate and it’s price-to-sales ratio (or valuation multiple), there’s a very well established correlation; until recently. Sales growth is about average, yet the multiple has rocketed from under 1x sales to over 2.2x. This is completely uncharacteristic given the last 30 years of data and is reflective of nothing more than bubble speculation. Fundamentals have no role in this. If the price-to-sales multiple comes back down to meet the fundamentals of the company, we’d be looking at a decline of ~65%. If on the other hand the multiple returns to prior cycle lows of around .4x sales as it has four times in the last 30 years, we’d be looking at a decline of more than 80% given todays level of sales. This would be catastrophic for Boeing shareholders.
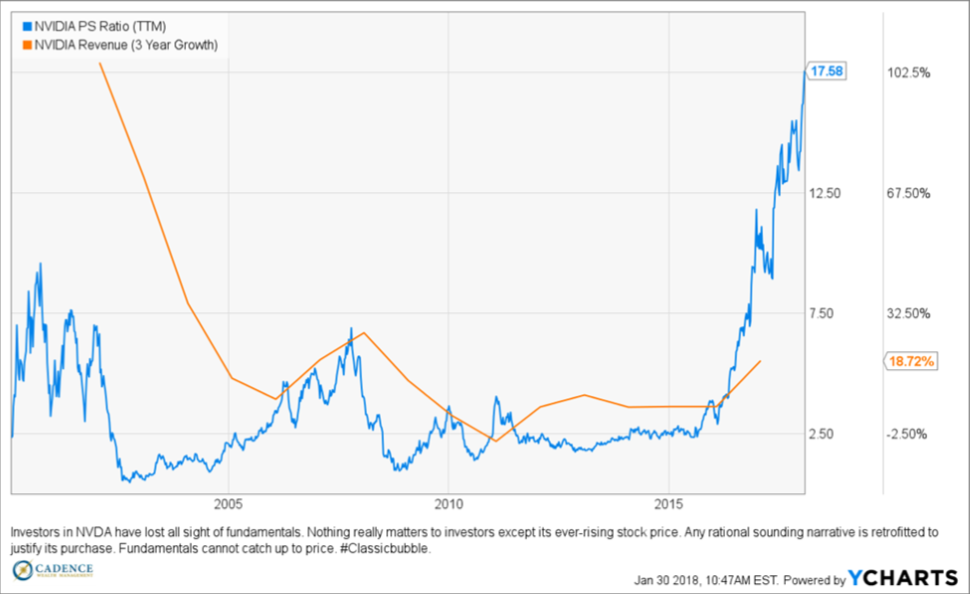
Now to the high tech example – Nvidia. Here’s a company that makes semiconductors for gaming consoles primarily, but has recently begun to foray into the virtual reality and blockchain businesses. The transition into these latter two lines of work has apparently been enough to cause valuations to depart sharply from Nvidia’s fundamentals. Although this is a company that would certainly warrant a higher multiple because of the potential for these additional business lines to ultimately succeed and pay off, what we’ve witnessed is a classic case of the hype outrunning reality.
Nvidia’s price-to-sales ratio at 17.5x is 175% higher than at the 2007 pre-crisis peak, yet its three-year average revenue growth rate is lower. Post-financial crisis, Nvidia’s price-to-sales ratio contracted from just over 6x to just over 1x. If this same thing happens again, investors banking on easy gains would stand to lose 94% from current levels. To a more average multiple of 2.5x and losses would still amount to a destructive 85%.
At some point, just like in every bubble in history, multiples and valuations will succumb to gravity. They don’t grow to the sky. The laws of finance and sound money always win out in the end when the final stages of bubble dynamics play out.
Conclusion
We don’t know how much higher stocks will go. They’ve broken virtually every record already and there’s nothing saying they couldn’t run up the score even higher before calling it quits. But this doesn’t change the fact that investors who don’t want to lose lots of money in a hurry shouldn’t care what the stock market does in the short term. From a risk management standpoint, if losses of 30-70% don’t appeal to you, then forget about the S&P 500 or the Dow Jones Industrial Average. Those are not your benchmarks. Investments that are a good value relative to their own historical fundamentals, or in some cases relative to other more expensive investment options, should be the focus. Making returns that one can keep has to matter more than logging big numbers for temporary gratification or bragging rights. Here at Cadence, we realize that there’s very little over the next few days and weeks that we can feel certain about. This world is large, complex, and unpredictable. The forces imparting influence on markets and policy will steer things in the direction they want them to go – for a little while.
If there’s one thing we feel very confident about, it’s that history matters. There are lessons littered throughout that human beings do their best to try and ignore when they don’t suit their interests; and so mistakes are repeated. This bubble, and there’s no doubt in our minds that it is one, will burst. It will likely be spectacular. It’s the central challenge of our financial planning and risk management mission as it relates to our clients. We know financial plans explode with bubbles and so we can’t afford not to take this one very seriously. We have nothing to gain by sounding dramatic. We only succeed when our clients do. And so we’re saying no thanks to McDonald’s, Boeing, and Nvidia. Don’t even ask us about Bitcoin. The broad stock market? Well, we’re recommending a significant underweight relative to very high quality bonds, cash and commodities. We’re excited about a world with better deals. It’ll be here before we know it.
Key Takeaways
→ The scale and scope of central bank intervention over the years has made this bull market unique. However, the result is the same. Stocks are in a bubble larger than any other in modern U.S. history. Bubble dynamics will likely operate going forward just as they have in the past. The fundamentals that prices have to drop back down to meet are a long way down.
→ There is an historic chasm between stock valuations and the growth rates present across corporations and the economy. Generally investors will pay a multiple of sales or earnings that is reflective of the underlying growth rates of those sales and earnings. This relationship has broken down recently signaling that what matters most to investors isn’t the fundamentals, but rather the fact that prices have been going up. This is classic bubble behavior.
→ This valuation-growth disconnect is happening not just within a few exciting sectors, but across the board. Companies that were once considered boring are being valued higher than they ever have been even though their fundamentals (growth rates) are running well below trend.
→ From a risk management standpoint, if losses of 30-70% don’t appeal to you, then forget about the S&P 500 or the Dow Jones Industrial Average. Those are not your benchmarks. Investments that are a good value relative to their own historical fundamentals or in some cases, relative to other more expensive investment options should be the focus.

