As of the time this article is being written, October has shaped up to be another stellar month for the stock market. Going back to the lows in March of last year, the S&P 500 has more than doubled, pretty much erasing the horrific experience of one of the most acute declines in history from investors’ memories. Chalk it up as just another near miss, shot across the bow, or tremor before the ever-so-elusive big quake. As the frequency of these temporary market declines increases, investors seem to grow more and more complacent and take bigger and bigger risks; after all, how else do markets get to new all-time highs? As this chain of events gathers momentum, it becomes harder for people to ignore. Those who have sat out grow regretful having missed the large gains, and ultimately capitulate and invest. Those who have participated in the large (and seemingly easy) gains begin to add leverage in order to magnify those gains. This is how cycles work, because after all, market cycles are driven by humans, and as much as we’d like to think we’re smarter than those who came before us, we’re not. Although every cycle is different in it’s length, magnitude, and particulars, they will always retain the general shape of a sine curve, and will cycle up and down over time accordingly. All this begs the question; where are we currently along the sine curve (our current cycle)?
When looking at the stock market relative to the amount of “stuff” that U.S. corporations are selling (basic definition of corporate gross value added or GVA), you can see from the chart below that the value of the S&P 500 cycles up and down over time around an average or mean (red line).
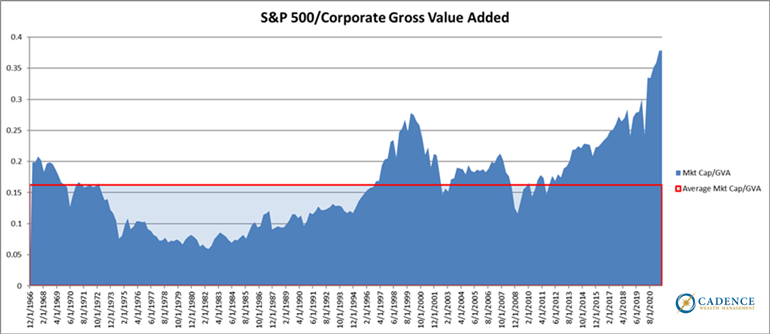
Toward the end of economic expansions and stock bull markets, investors are willing to pay more for stocks (late 60’s, late 90’s, and now), whereas when the economic situation grows more dire and market experiences less rewarding, it takes far cheaper prices to induce investors to buy them (70’s, and a short period of time in 2008-2009). If our chart went back another 50 years, we’d see that investors paid above average prices for stocks in the late 1920’s, which led to stocks being valued well below average throughout the 30’s and into the 40’s. These big, long cycles appear to run in 35 to 40-year increments when left to do their thing in a relatively natural way. Of course, this is the part where we remind you that nothing about the last 20 years has been natural. With central bank intervention running at unprecedented levels and government debt, as a result of aggressive fiscal spending to keep things chugging, shooting from 55% to 125% of GDP since 2000, the natural, cleansing, reset part of this cycle hasn’t been allowed to play out. If you’re wondering if there are consequences that come with that, just look around. We would venture to say that most of the economic disparity, social strife, and general unease we’re witnessing is directly related to our inability to let the economic and market chips settle where they may, but settle they eventually will. Cycles have not been abolished.
We’ve developed some humility over the years watching Sisyphus continue to roll this boulder up the hill, and so who’s to say he can’t keep it from rolling downhill a bit longer? When he does finally lose his grip however, that’s when the damage done will likely be completely relative to how far up the hill the boulder was perched and for how long. Whole villages get built at the bottom of the hill when the townspeople don’t think it’s possible that the boulder and gravity will eventually prevail. Back to the chart on the previous page showing the S&P 500 relative to the stuff those companies sell (GVA), or how much investors are paying relative to that stuff, never higher and never more. The boulder is as far up the hill as it’s ever been and it’s been up there almost uninterrupted for about 25 years.
So, what does this mean?
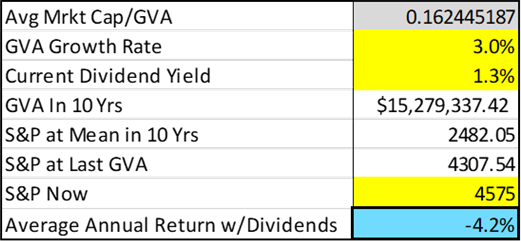
It means that if over the next 10 years, the S&P 500 works its way back into balance with the long-term average (between its price and the level of corporate gross value added), investors would average -4.2% per year over that 10-year period (table on the following page). They would essentially have 30% less money after 10 years because they paid too much. How does this happen? Simple. It’s most comfortable to invest when things are going great and have been for a while. This tends to be the case toward the end of long-term cycles when things are way too expensive. If one wants to make money in markets that they can hold onto and not lose in a puff of smoke down the line, he or she should invest most aggressively when markets are cheap and nobody else wants to buy them. Invest in a balanced way when markets are fairly priced and dial it back a fair amount and impart more discipline as they get expensive. Finally, when the market’s price no longer makes sense, find another investment that does.
The assumptions below assume the current dividend of 1.3% applies to the current market level throughout the 10-year period, GVA growth will equal 3% over that period of time. This is consistent with the decelerating trend in economic growth we’ve seen over the last 20-30 years. We expect the GVA growth rate of 3.7% over the last 20 years will slow to 3%.
How patient should I be?
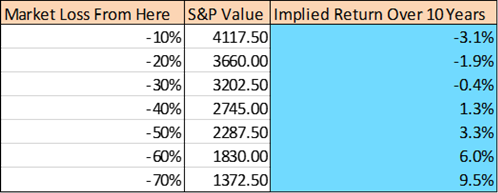
Let’s put it this way. If you’re waiting to reinvest in the major stock market indexes until they offer better long-term prospects, you can go on vacation for a week or two and won’t miss an opportunity. The table below illustrates what return prospects would be over a 10-year period following different percentage declines in the S&P 500. As you can see, buying and holding a 10% drop in the market only improves your 10-year return to -3.1% annually. More patience please. After a 50% or 60% decline, we’re looking better. Again, this isn’t an all or nothing exercise. As markets get more and more attractive, one can get more and more aggressive, proceed to fall asleep on the job, and probably still be okay.
So, the takeaway should be this: If you’ve turned off the television and are now better able to think longer term, full cycle, then you’re probably realizing the investment gains you’ll have 10 years from now are not the ones people are chasing today. They’re the ones that come either from investments that offer good value right now (not the same ones the masses are focused on) or from the popular investments of the day that are bought at much lower levels at some point down the line. That 100% gain in the S&P since the March 2020 lows? It’ll most likely vanish at some point and will be just as much a distant memory as the -35% five-week drop back in February and March 2020 is to investors today. Part of what makes investing so hard is remembering that growth only matters if you keep it. The best way to execute on this is to have a process that doesn’t allow you to get caught up in the emotion of the day. Buy what makes sense and wait on the stuff that doesn’t. The good news is that there’s almost always something that makes sense. Today is no exception.
Editor’s Note: This article was originally published in the November 2021 edition of our “Cadence Clips” newsletter.
Important Disclosures
This blog is provided for informational purposes and is not to be considered investment advice or a solicitation to buy or sell securities. Cadence Wealth Management, LLC, a registered investment advisor, may only provide advice after entering into an advisory agreement and obtaining all relevant information from a client. The investment strategies mentioned here may not be suitable for everyone. Each investor needs to review an investment strategy for his or her own particular situation before making any investment decision.
Past performance is not indicative of future results. It is not possible to invest directly in an index. Index performance does not reflect charges and expenses and is not based on actual advisory client assets. Index performance does include the reinvestment of dividends and other distributions
The views expressed in the referenced materials are subject to change based on market and other conditions. These documents may contain certain statements that may be deemed forward‐looking statements. Please note that any such statements are not guarantees of any future performance and actual results or developments may differ materially from those projected. Any projections, market outlooks, or estimates are based upon certain assumptions and should not be construed as indicative of actual events that will occur. Data contained herein from third party providers is obtained from what are considered reliable sources. However, its accuracy, completeness or reliability cannot be guaranteed.
Examples provided are for illustrative purposes only and not intended to be reflective of results you can expect to achieve.

