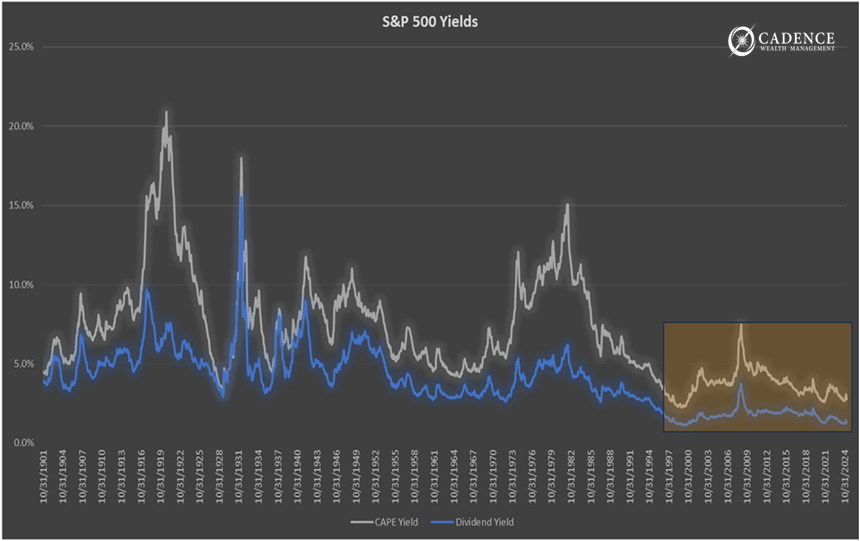
For 95 years since 1902, the cyclically adjusted earnings yield for the S&P 500 has averaged 7.9% and the dividend yield, 4.6%. Since 1997, they have averaged 3.7% and 1.8% respectively. Currently, they are 2.8% and 1.3%. Combined, investors could expect to earn 4.1% from corporate earnings growth and dividends, which is a full 8.4% below the long term, almost 100-year average. It is also below the “risk-free yield” of the 10-year U.S. treasury at 4.25%.
Below, we can see just how anomalous this return profile for the market is and has been. Historically, we’ve seen other low points just before major bear markets in stocks in 1929, the late 1960’s (which also lasted for an exceptionally long period of time), and the late 1990’s tech stock bubble. It’s worth noting that the last period of prolonged, low-yielding stock markets in the 1960’s resulted in the largest companies comprising an inordinate share of stock market capitalization (“Nifty Fifty”), cheap commodity prices, and a secular rise in inflation. All of these variables are being observed today. As we can also see in the chart below, as stocks fell over the 14 years from 1968 to 1982, yields rose to much more normal, if not cheap, levels. What doesn’t appear in the chart below is that natural resources, the investments neglected in the years prior, performed incredibly well over that same period.
The moral? Just as high yields don’t last forever, neither do low yields – despite how normal or safe they might feel. 124 years of history show pretty clearly just how abnormal the current situation really is. From such low yields, getting back to normal can really hurt.
Editor’s Note: This article was originally published in the July 2025 edition of our Cadence Clips newsletter.
Important Disclosures
This blog is provided for informational purposes and is not to be considered investment advice or a solicitation to buy or sell securities. Cadence Wealth Management, LLC, a registered investment advisor, may only provide advice after entering into an advisory agreement and obtaining all relevant information from a client. The investment strategies mentioned here may not be suitable for everyone. Each investor needs to review an investment strategy for his or her own particular situation before making any investment decision.
Past performance is not indicative of future results. It is not possible to invest directly in an index. Index performance does not reflect charges and expenses and is not based on actual advisory client assets. Index performance does include the reinvestment of dividends and other distributions
The views expressed in the referenced materials are subject to change based on market and other conditions. These documents may contain certain statements that may be deemed forward‐looking statements. Please note that any such statements are not guarantees of any future performance and actual results or developments may differ materially from those projected. Any projections, market outlooks, or estimates are based upon certain assumptions and should not be construed as indicative of actual events that will occur. Data contained herein from third party providers is obtained from what are considered reliable sources. However, its accuracy, completeness or reliability cannot be guaranteed.
Examples provided are for illustrative purposes only and not intended to be reflective of results you can expect to achieve.

