In this month’s Cadence Clips newsletter, we discussed the fact that not all is well within the belly of this bull market. Although indexes are near all-time highs, that’s not the case for all stocks within those indexes. We refer to this phenomenon as internal divergence or the market having “weak internals”. In assessing the state of the market internals, we made reference to the S&P 500 Equal-Weighted Index as well as the Dow Transportation Index and observed a market that appears very sick from within. Below are two follow-up charts to our Clips discussion that provide both a longer-term perspective and a recent update.
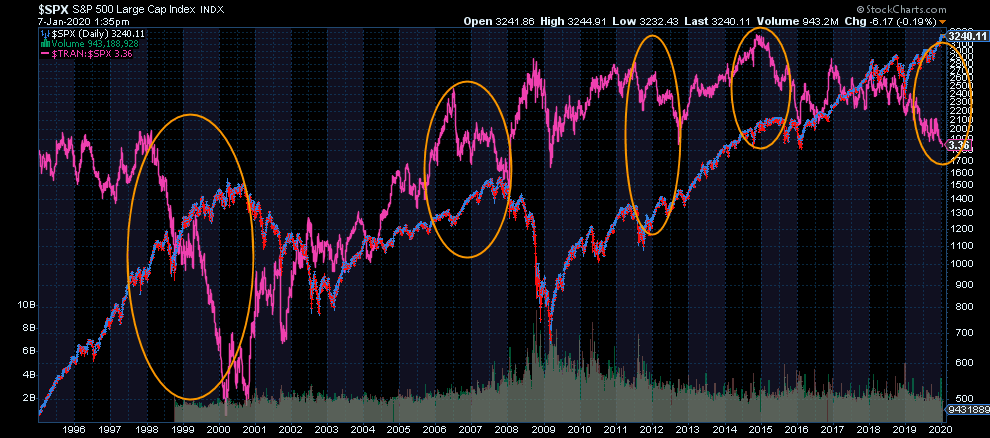
First, the transportation sector. Since the beginning of 2018, we’ve witnessed transportation stocks moving lower while the broad stock market has moved to new price highs. A look back 25 years provides some perspective on how a sharp divergence between these two measures can resolve itself. With the exception of one occurrence, 4 out of 5 incidents led to the broad market breaking down and following transportation stocks lower. It’s also important to note that that one exception took place in late 2012 during a business cycle slowdown that resulted in aggressive central bank intervention. It apparently worked in pushing off the worst of the downturn. At least until 2015, then again in late 2018. It feels very much like the recession dog has been scratching and will continue scratching at the door until it is let in. Here we are again in the middle of a business cycle slowdown which the economic data makes very clear. The transportation sector is confirming this, just as it has in the last few business cycle slowdowns. Whether the dog gains forceful entry into the house this time and the broad market follows the transports lower, we’ll have to see. This chart suggests the odds are good that it will.
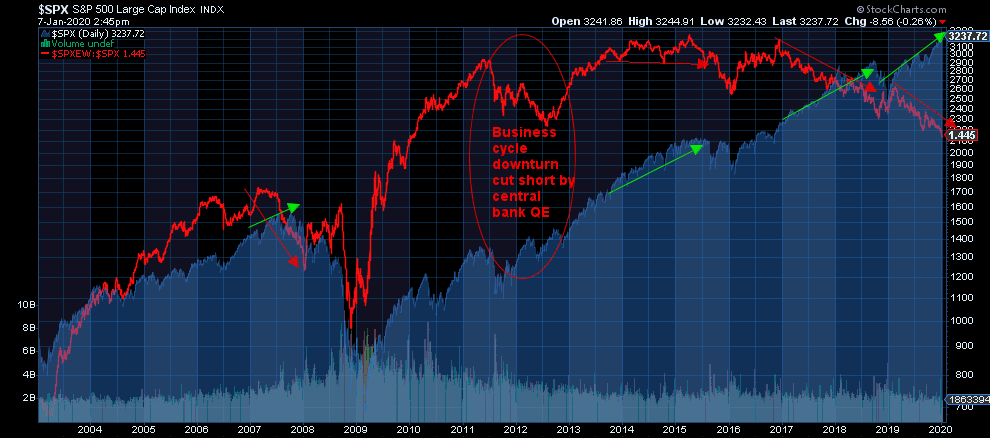
With respect to the Equal-Weighted S&P 500, where all companies are weighted equally in determining performance as opposed to the more well-known Cap-Weighted S&P 500 index (blue shaded area below) where performance is driven by the biggest companies, we can clearly see a continuation of weakness within the broad market. In the chart below, a downward sloping red line suggests that the average company in the index isn’t doing as well as the few largest companies. An aggressively sloping line suggests a more dramatic divergence in performance. What we’re seeing now is consistent with what was seen before the last two recessions and stock bear markets. This however, has been by far the most extreme and protracted divergence since the introduction of the indexes and more importantly, ETF’s.
This could well be attributable to investment flows into ETF’s which are blind to price and value. They are completely price indiscriminate. This drives the big expensive stocks even higher without a care as to the dangers of doing so. What most “passive” investors fail to recognize is what happens when this indiscriminate buying gets thrown into reverse and becomes indiscriminate selling. The recent three-year outperformance of the big capitalization-weighted ETF’s shown in the chart below, along with what the transports are messaging, suggests that the unwind of these passive money flows could be quite a spectacle. In the end, the cause for the divergence between the largest companies in the market and the rest of them may not matter as much as the divergence itself. Alligator jaws always close, just as things in nature seem to always find a way to strike a balance. One should plan for this.
Important Disclosures
This blog is provided for informational purposes and is not to be considered investment advice or a solicitation to buy or sell securities. Cadence Wealth Management, LLC, a registered investment advisor, may only provide advice after entering into an advisory agreement and obtaining all relevant information from a client. The investment strategies mentioned here may not be suitable for everyone. Each investor needs to review an investment strategy for his or her own particular situation before making any investment decision.
Past performance is not indicative of future results. It is not possible to invest directly in an index. Index performance does not reflect charges and expenses and is not based on actual advisory client assets. Index performance does include the reinvestment of dividends and other distributions
The views expressed in the referenced materials are subject to change based on market and other conditions. These documents may contain certain statements that may be deemed forward‐looking statements. Please note that any such statements are not guarantees of any future performance and actual results or developments may differ materially from those projected. Any projections, market outlooks, or estimates are based upon certain assumptions and should not be construed as indicative of actual events that will occur. Data contained herein from third party providers is obtained from what are considered reliable sources. However, its accuracy, completeness or reliability cannot be guaranteed.
Examples provided are for illustrative purposes only and not intended to be reflective of results you can expect to achieve.

