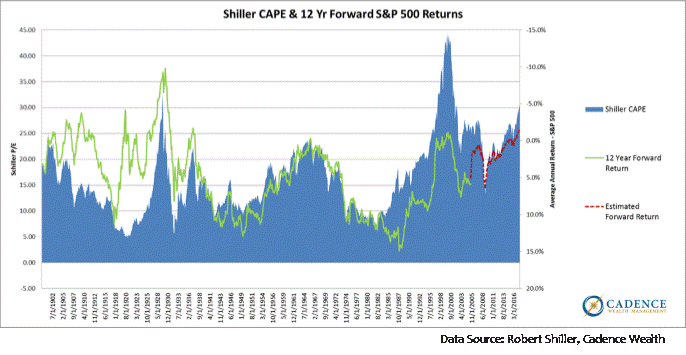
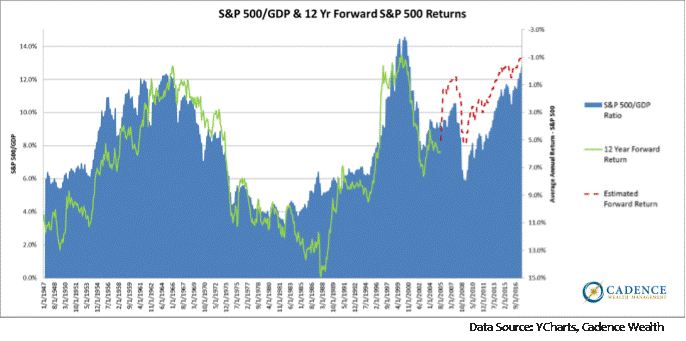
Let’s keep this simple. U.S. stocks by almost any measure that doesn’t obscure reported earnings are either at or very near record levels. Here’s a look at a couple valuation measures we’ve discussed in the past – the Shiller CAPE and the S&P 500/GDP. What’s immediately noticeable from both measures (shaded in blue) is that they are toward the top of their historical ranges, exceeded only by the tech bubble in 1999. What both of these charts don’t show however is what happens when we adjust for the above average corporate margins and below average economic growth that we’re observing today. When taking these things into account (the former we discuss in the March 2017 letter “Is It Too Late To Jump In”), valuations shoot right up to where they were in March 2000 if not beyond.
What’s more relevant to investors than record-setting stock valuations however, is what tends to happen to actual portfolio returns when this condition exists. The green lines in the charts below represent returns that investors in the S&P 500 actually would have received over the next 12 years from the date plotted. What we can see is that these forward returns correlate very closely to how expensive or cheap markets are at any point in time. As an example, when we look at the Shiller CAPE chart, we can see that stocks were much more expensive than usual in 2000 and as a result, the average annual return an investor in the S&P 500 would have received from 2000 to 2012 would have been below 0%. We had another 12 year stretch of below 0% returns beginning in 1966 when stocks were historically expensive. It would have taken until after 1978 to get back into positive territory. The horrendous market returns of the 1930’s correlate very closely with the richly valued market in the late 1920’s. It’s very clear that expensive markets as measured by the two metrics below tend to precede below-average long-term returns – in some cases by a large margin. The degree of overvaluation tends to correlate very highly to the degree or severity of the subsequent underperformance.
It’s also important to note what the 12-year subsequent market returns have been 2-3 years before past peaks in market valuation. For example, had an investor been fully allocated to the S&P 500 in 1997, he would have enjoyed 2 more years of incredible market gains. Ultimately however, his total return by 2009, 12 years later, would have been around 0%. A full investment in the S&P 500 in 1925 would have enjoyed almost 5 additional years of record-setting gains up until the market turn in late 1929. By 1937 however, that investment would be just about where it started. So here’s the point, and this is very important: Being early to reduce risk in expensive markets doesn’t mean you’ve missed out on gains that you can never get back, because those gains ultimately don’t stick anyway. Expensive markets tend to get more expensive before they revert back toward their longer-term averages. This is to be expected. In the end, avoiding over-exposure to expensive markets is the goal, not necessarily trying to time the ultimate turning point.
Now, here’s where things get really exciting. What we can also see very clearly from this data is that returns get very, very good when markets are valued cheaply. In the 1940’s as well as the mid 1970’s into the 80’s, returns over the following 12 years were well above average – north of 10% per year for the S&P 500. There are also plenty of points where returns would be “good enough” for most investors to reach their investment objectives. When valuations are reasonable or cheap, good returns tend to follow over time.
The point is this – the price we pay now determines the returns we can expect over the long term. The steep valuations we’re experiencing today are not normal and won’t persist forever. There will be better opportunities down the road that will allow for much better return potential than those we’re facing now. Seth Klarman, an extremely successful value-oriented hedge fund manager in Boston has likened that feeling that we have to choose our investments from today’s opportunity sets to thinking that we have to find our future husband or wife from our classmates in high school. The reality is that we may find a much better match in college, at our first job, a future networking event, etc. Klarman suggests the same is true with investments. The reality is that our investment choices don’t just include the opportunity sets presented to us today, but also those from the future. As we’re seeing from historical valuation and return relationships, the best investment opportunities (for equities anyway) are very likely to be in the future.
The above content is an excerpt from our September 2017 Cadence Clips newsletter. Please read the article in its entirety here.


